
Bellingcat est un groupe international indépendant de chercheurs, d’enquêteurs et de journalistes citoyens utilisant à la fois enquêtes open source et réseaux sociaux
▷ BELLINGCAT FRANÇAIS
01.10.2026 à 15:46
Viral Google Maps Images Shared Widely This Week Show Gaza Ruins. We Obtained More Recent Satellite Imagery
Jake Godin
Earlier this week, several viral social media posts and news articles stated that Google had updated satellite imagery over Gaza. The imagery shared in these posts and articles shows several areas, including the southern city of Rafah. Huge destruction is detailed in the images, including what appears to be entire neighbourhoods flattened But the imagery […]
The post Viral Google Maps Images Shared Widely This Week Show Gaza Ruins. We Obtained More Recent Satellite Imagery appeared first on bellingcat.
Texte intégral (1661 mots)
Earlier this week, several viral social media posts and news articles stated that Google had updated satellite imagery over Gaza.
The imagery shared in these posts and articles shows several areas, including the southern city of Rafah. Huge destruction is detailed in the images, including what appears to be entire neighbourhoods flattened
But the imagery wasn’t entirely new.
A Google spokesperson told Bellingcat that they regularly updated third-party satellite images and that the latest Gaza imagery had actually been available since June 2026.
Tomorrow's front page
— The National (@ScotNational) September 28, 2026
New satellite pictures lay bare Israel's destruction of Gaza pic.twitter.com/E65GXUHwrG

Social media posts from earlier this year also detailed how Google Earth Pro users (a program that needs to be downloaded) had been analysing what appears to be the same imagery that was showcased this week by media outlets as early as May.
— Stinky (@Stinky915846091) May 22, 2026
Google Earth has updated its satellite imagery to 2026 for the central and south Gaza strip.
In this thread, we will be going over some areas that I found interesting while I explored the update.
If you want a screenshot of a site, reply with the coordinates, and ill send. https://t.co/rPYzpKNRmW pic.twitter.com/iZpncz6bVH
Bellingcat has access to satellite imagery from commercial space company Planet Labs, which shows further destruction in Rafah after the June Google update.
The Planet Labs imagery also gives insight into destruction further north in Gaza as recently as September.
Demolitions and Destruction Continue
The Google imagery updated in June showed a satellite image captured by the Airbus satellite imagery provider several months prior, in February 2026.
When compared to a previous image of the same area that was published and visible on Google in June 2024, the difference is stark. Entire neighbourhoods have been razed while several school facilities near the Tal as Sultan area appear to be among the most prominent buildings still standing.
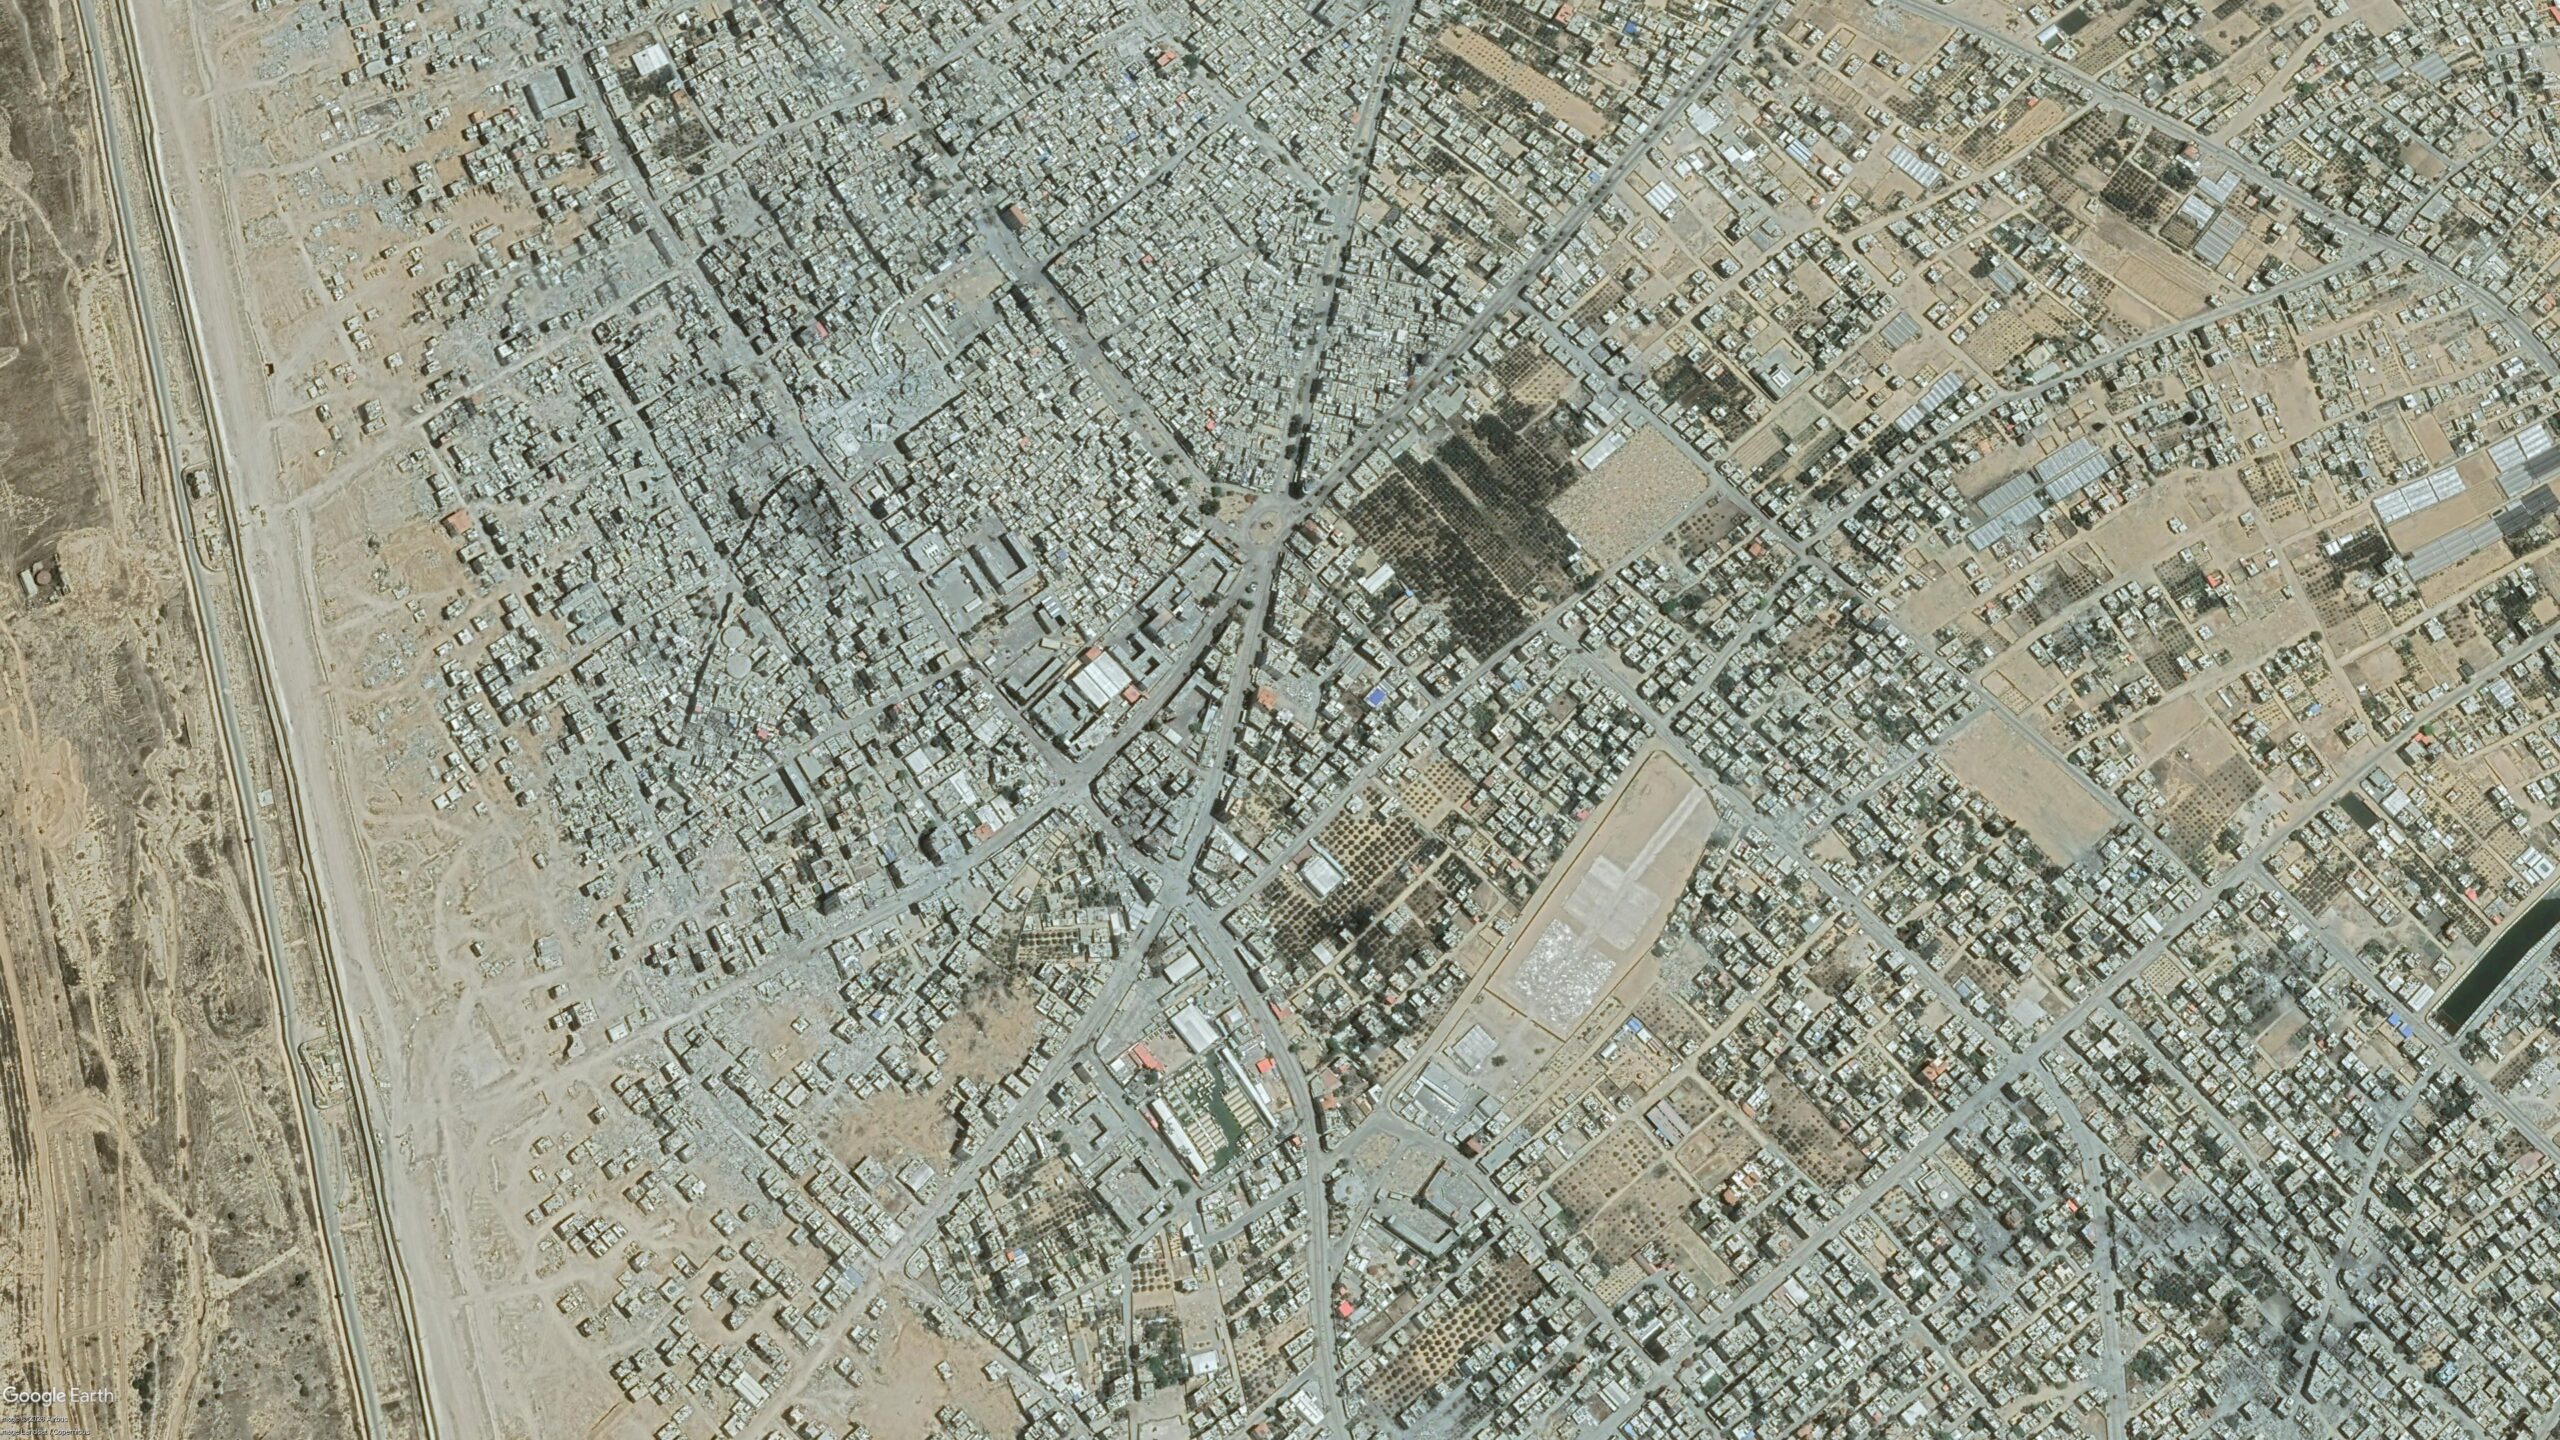
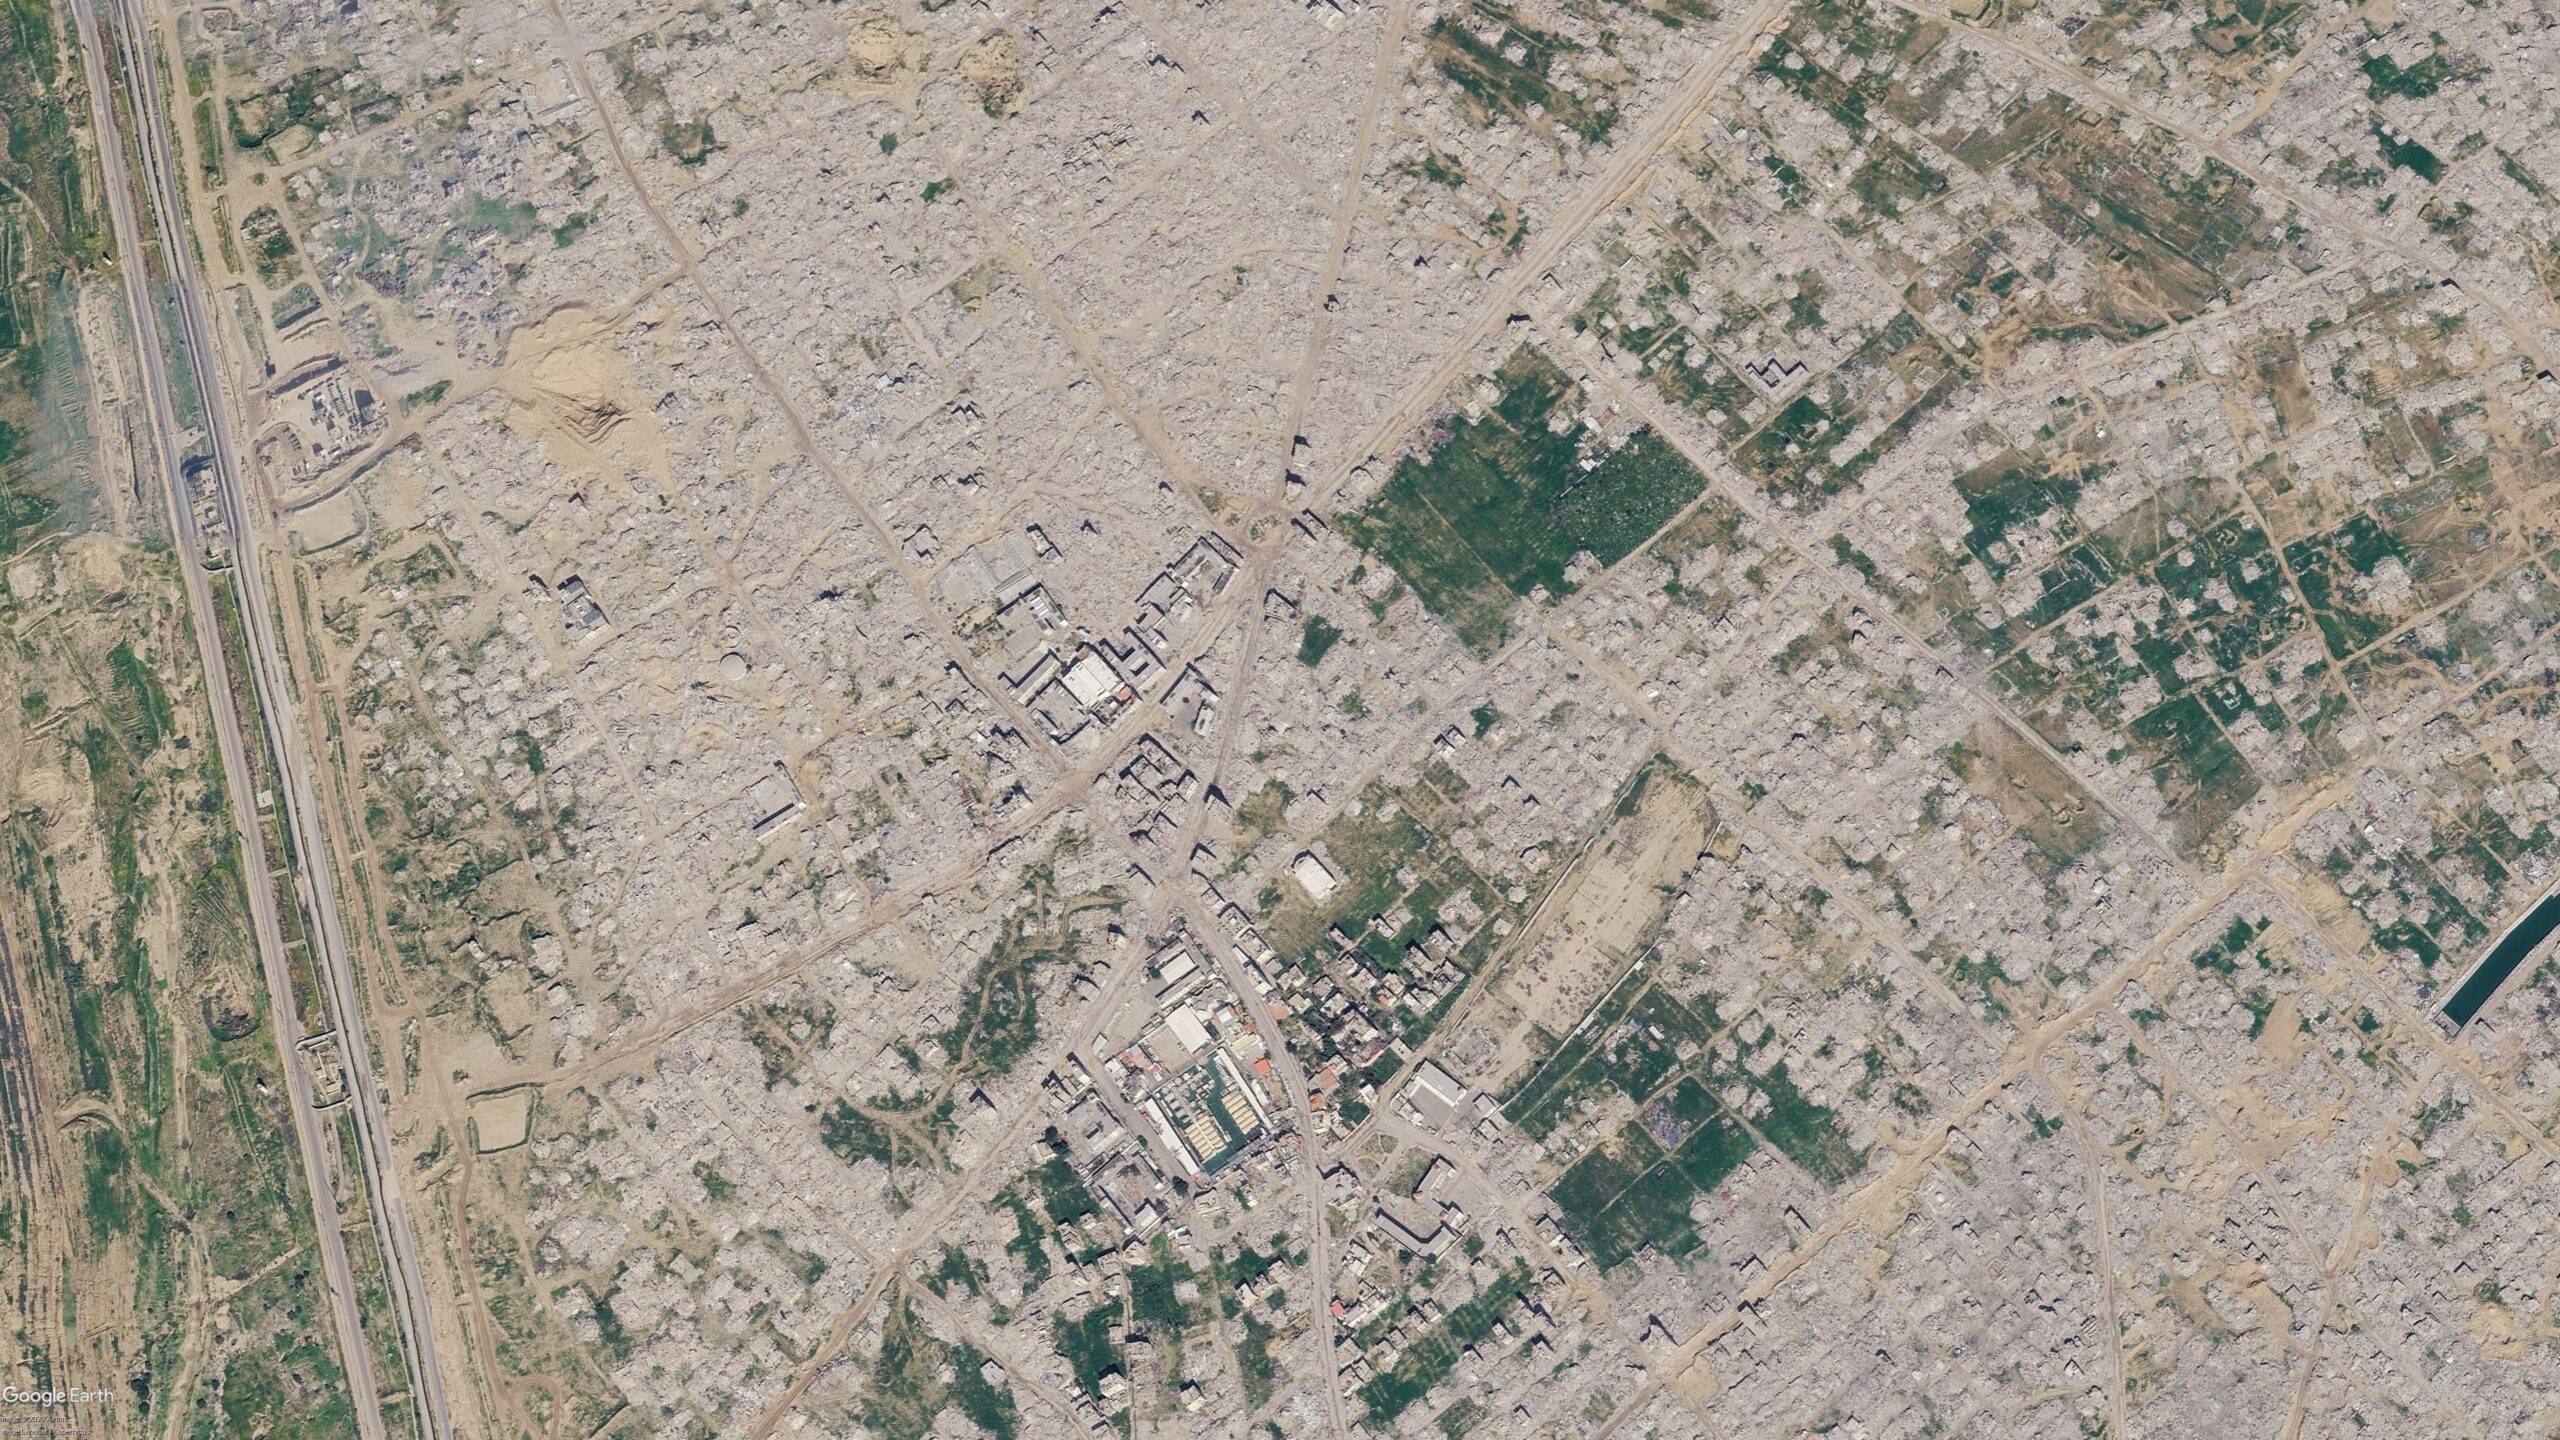
Satellite imagery shows visible changes across Rafah between June 2024 (left) and February 2026 (right). Image credit: Airbus via Google Earth.
Bellingcat previously reported on this destruction when it first started taking place in 2024. And the demolitions have continued since Google published its latest Airbus images in June.
The most recent high resolution imagery from Planet Labs, which uses its own constellation of satellites called SkySat, was taken in September. This was seven months after those now displayed on Google, and shows buildings near Rafah’s municipal stadium have now been demolished.
A number of schools and other buildings near the Tal as Sultan area previously still standing to the northwest of the stadium are also now shown to have been demolished in the September imagery.
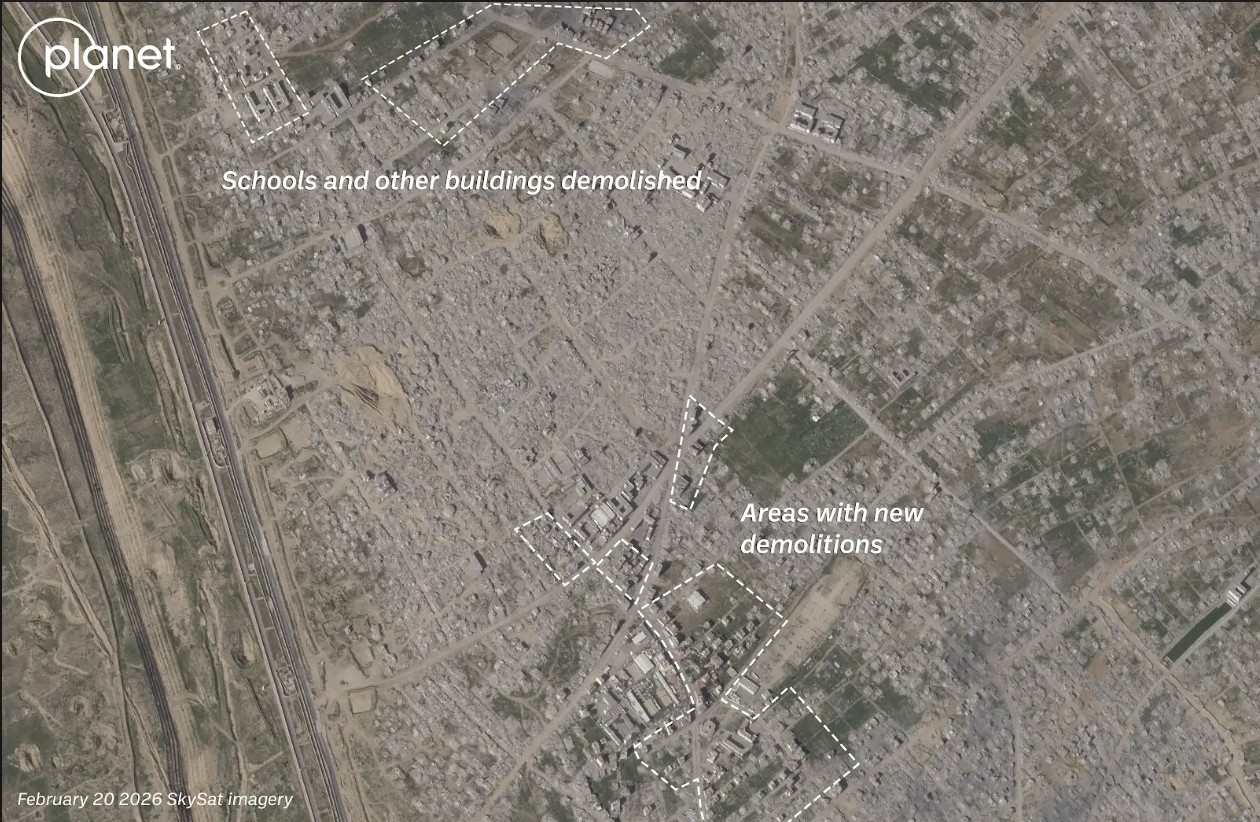
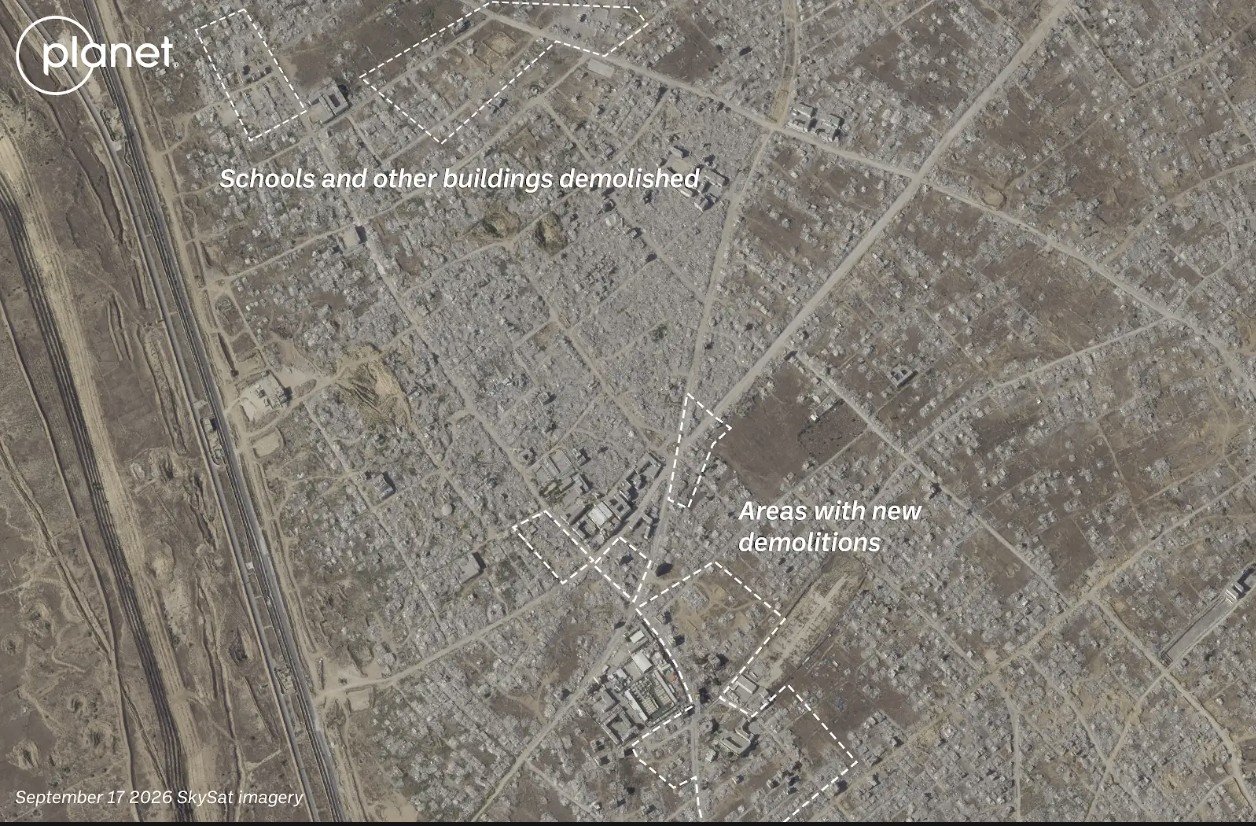
Satellite imagery shows visible changes across Rafah between February 2026 (left) and September 2026 (right). Image credit: Planet Labs PBC.
The centre of Bani Suheila, a town just to the east of Khan Yunis in southern Gaza, also looks drastically different from how it appears in the Google imagery.
While most of the buildings surrounding the centre of the town are visibly damaged or destroyed in the Airbus imagery, updated imagery from Planet shows that even more of the buildings have been reduced to rubble, with an IDF outpost now visible on top. A large earthen barrier is also visible, cutting through the town from north to south.
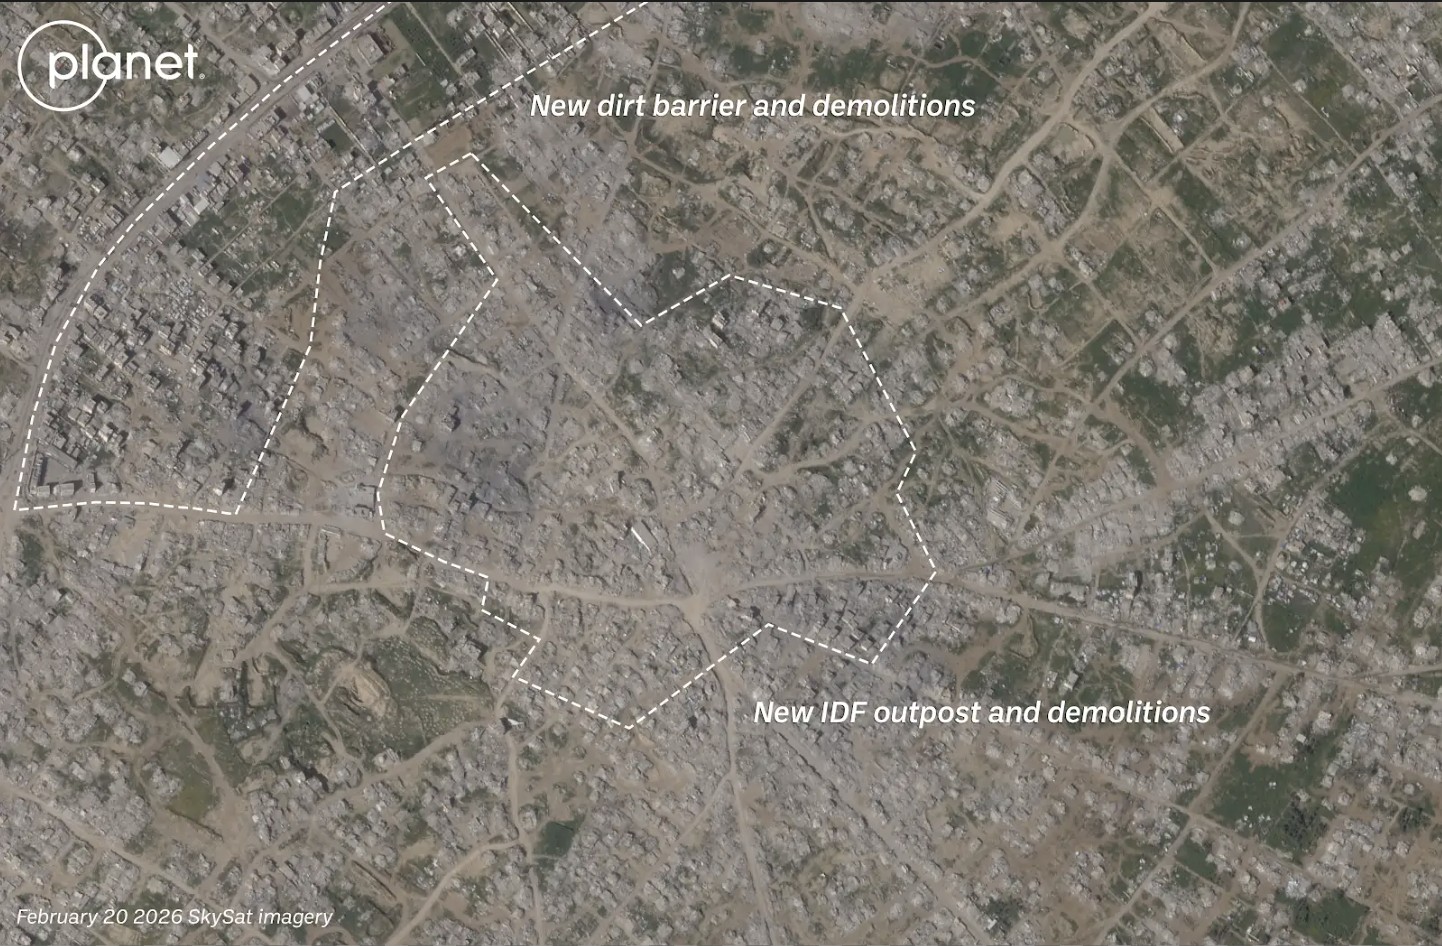
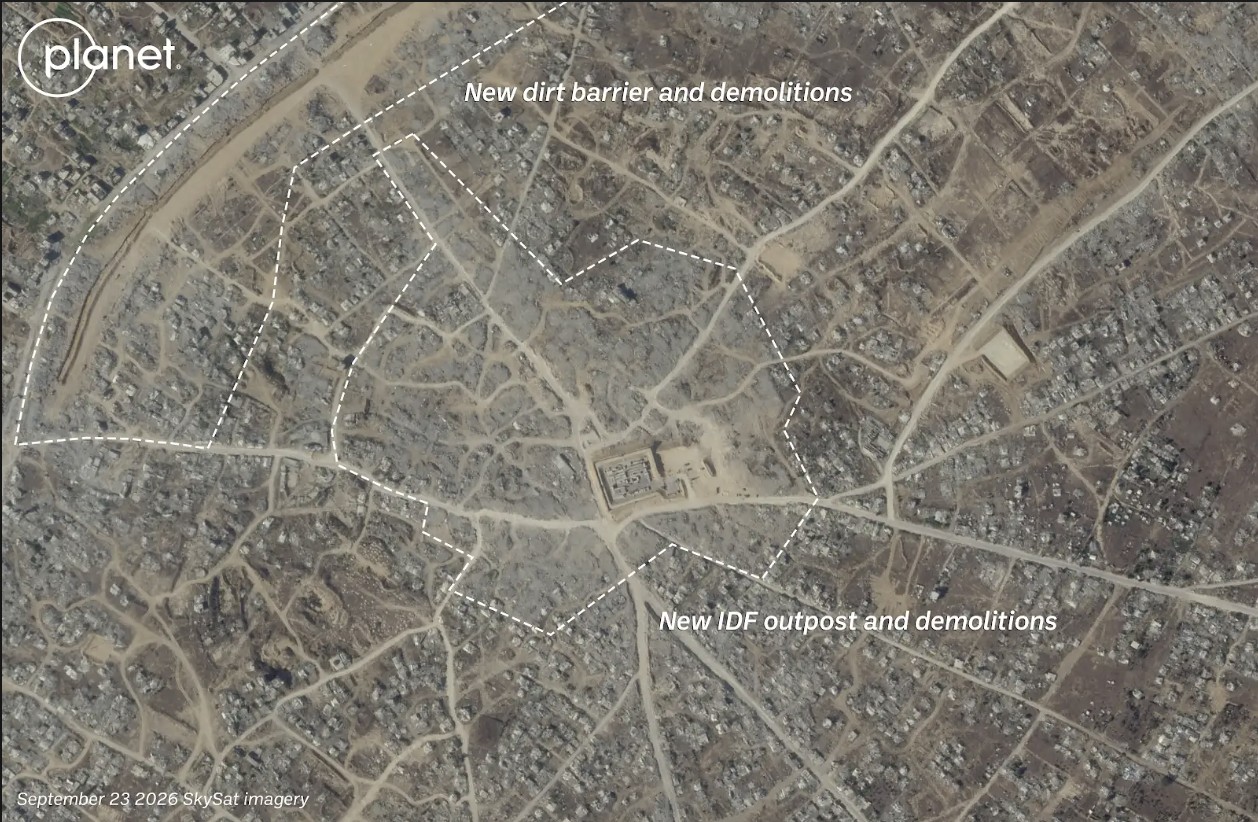
Satellite imagery shows visible changes in town of Bani Suheila between February 2026 (left) and September 2026 (right). Image credit: Planet Labs PBC.
Recent Planet Labs imagery also shows the level of destruction in northern Gaza, primarily in the eastern areas of the towns of Shujaiya and Jabaliya.
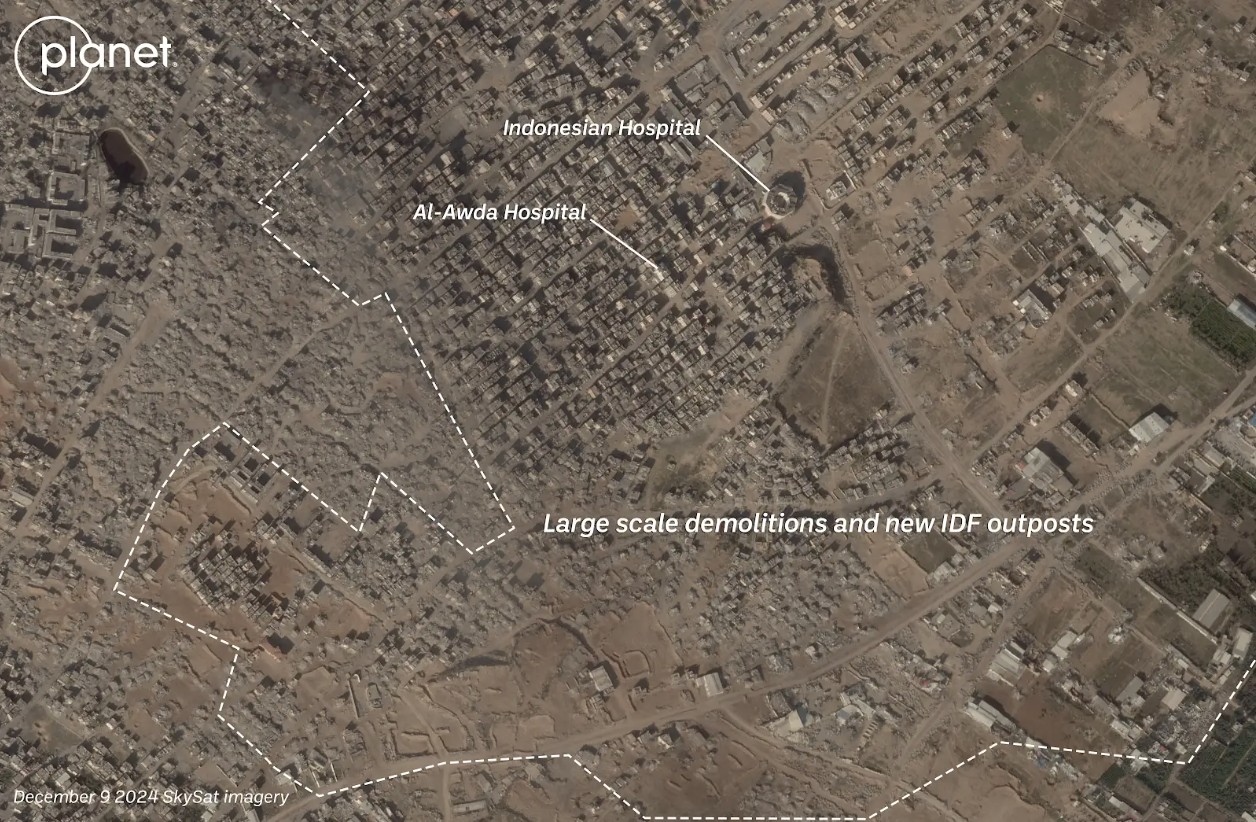
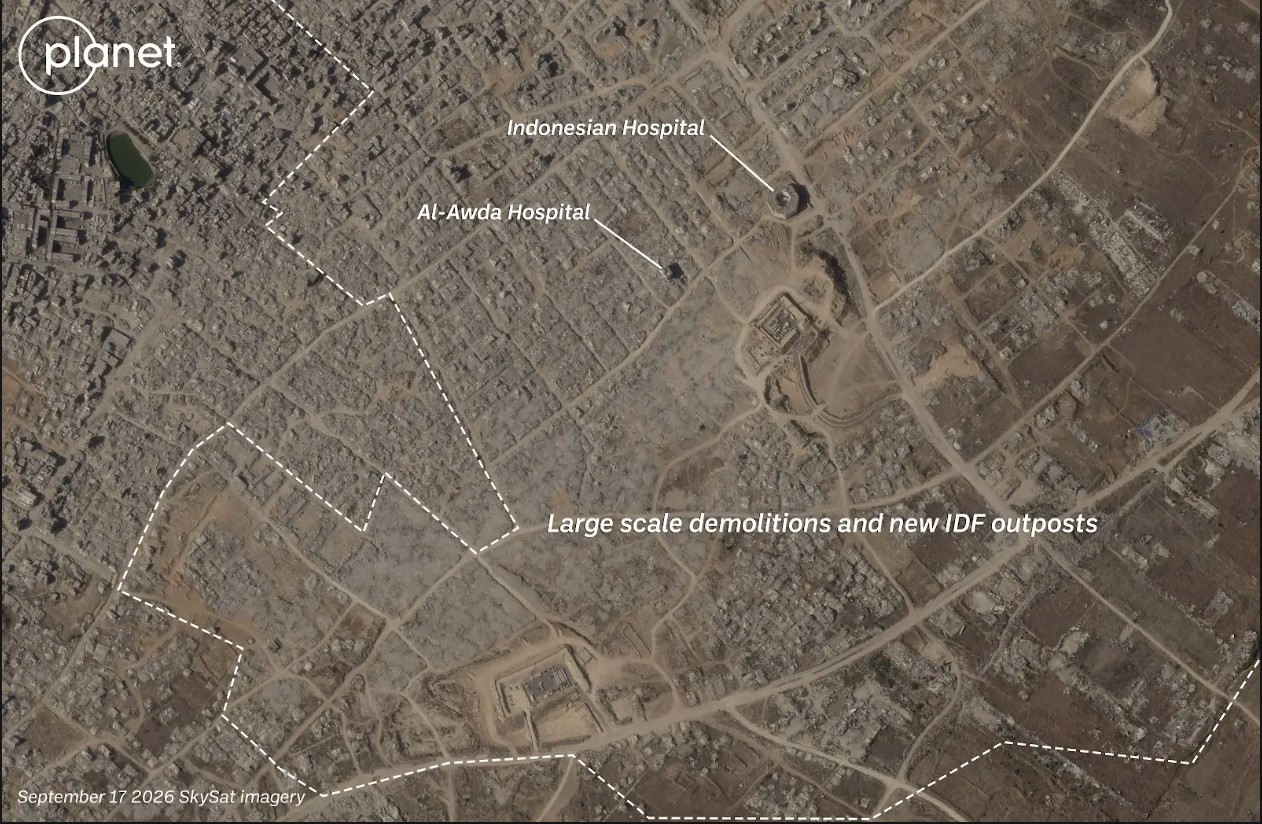
Satellite imagery shows visible changes in town of Jabaliya between December 2024 (left) and September 2026 (right). Image credit: Planet Labs PBC.
Both Shujaiya and Jabaliya were already heavily damaged before the most recent ceasefire. Satellite imagery shows that the IDF has continued razing large parts of both neighbourhoods while building outposts.
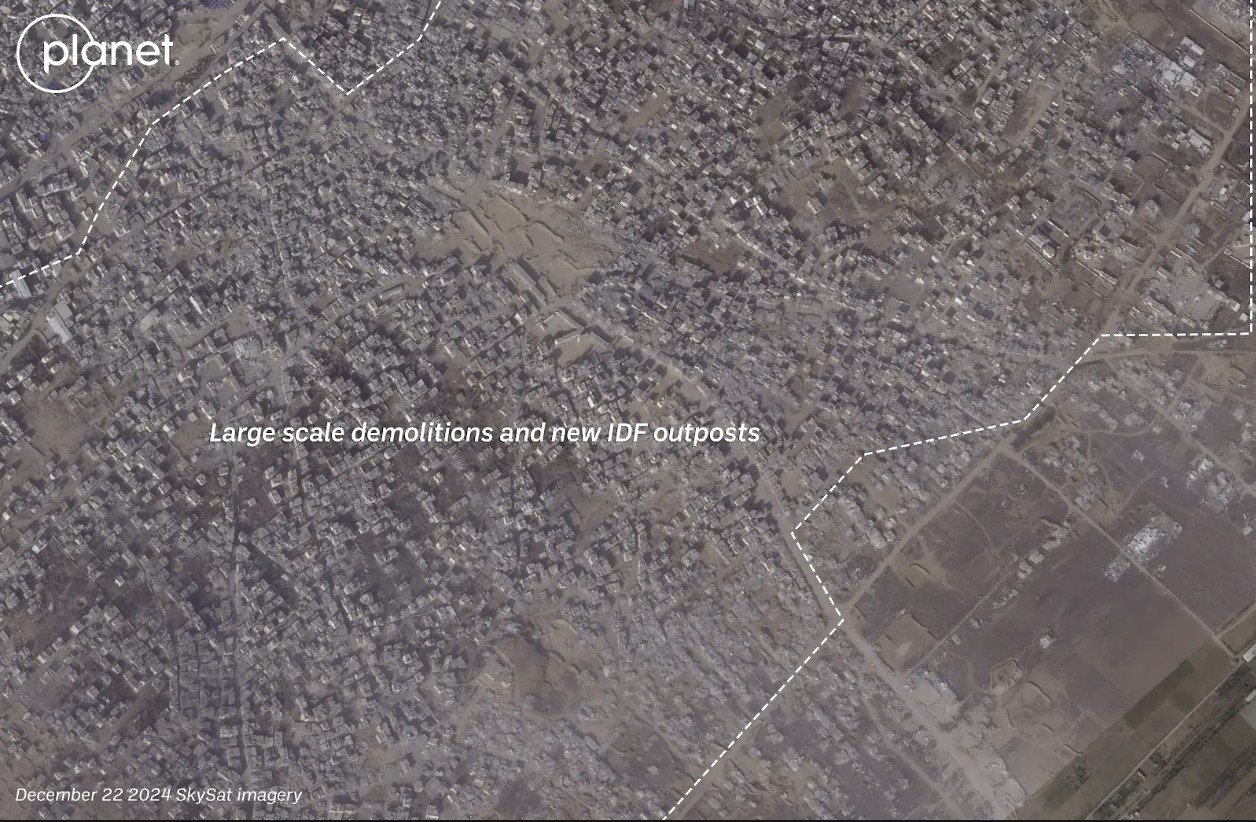
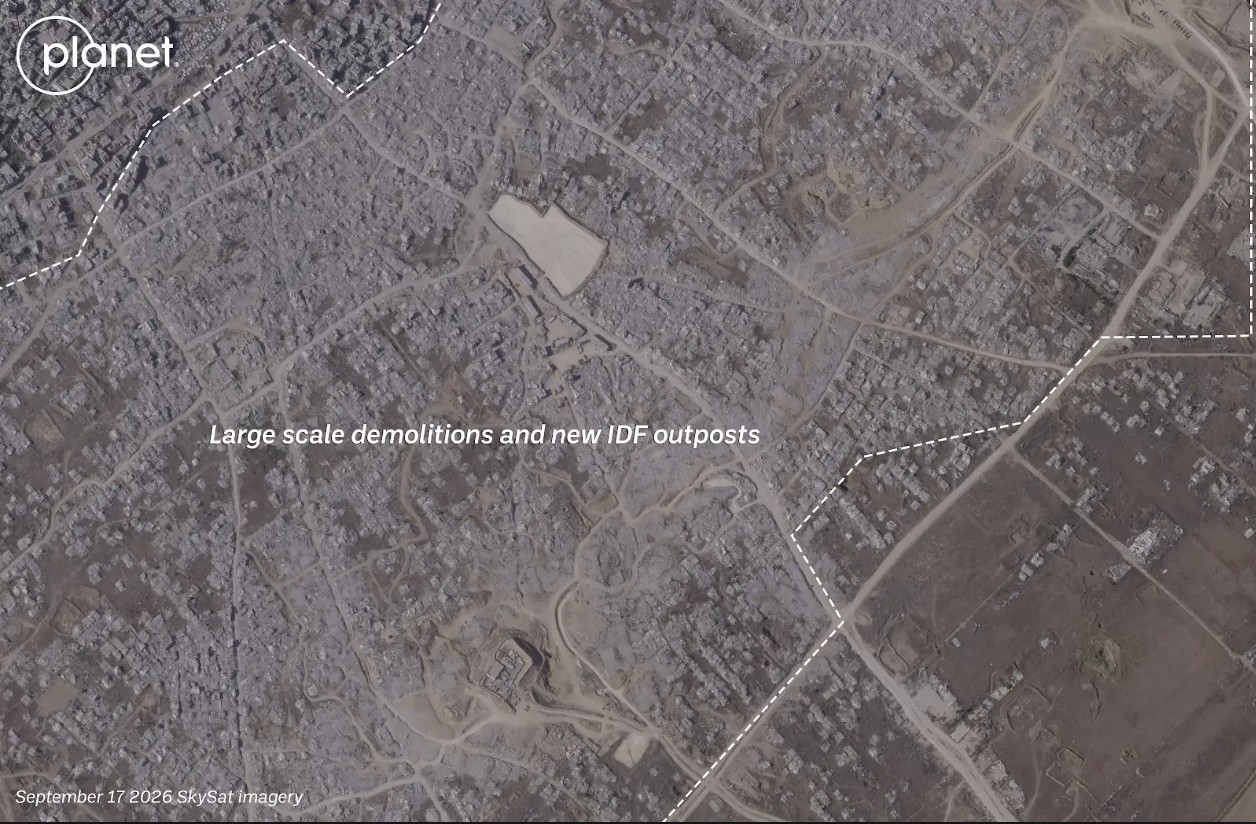
Satellite imagery shows visible changes in town of Shejiya between December 2024 (left) and September 2026 (right). Image credit: Planet Labs PBC.
Earlier this week, reports also surfaced that an Israeli satellite imagery provider had released images over northern Gaza before they were taken down.
Satellite images such as these appear to show that Israel has not stopped reducing buildings in Gaza to rubble despite the continuation of an official ceasefire.
Israel previously told media that the mass demolitions were part of an effort to “demilitarise” Gaza.
According to United Nations data, about 82 percent of the structures in Gaza are damaged, with two -thirds of them destroyed.
With international journalists still widely unable to enter Gaza freely, satellite imagery remains one of the only ways to assess the true scale of destruction and to understand what is happening on the ground.
Bellingcat is a non-profit and the ability to carry out our work is dependent on the kind support of individual donors. If you would like to support our work, you can do so here. You can also subscribe to our Newsletter and follow us on Bluesky here, Instagram here, Reddit here and YouTube here.
The post Viral Google Maps Images Shared Widely This Week Show Gaza Ruins. We Obtained More Recent Satellite Imagery appeared first on bellingcat.
19.09.2026 à 19:46
Christy Kinahan’s UAE Residence Visa Cancelled
Financial Investigations Team
This article is the result of a collaboration with The Sunday Times. You can find their corresponding piece here. Sign up here to receive Bellingcat’s biggest investigations by email as soon as they are published. Christy Kinahan, the Irish founder of the Kinahan Organised Crime Group who is being pursued by authorities around the world […]
The post Christy Kinahan’s UAE Residence Visa Cancelled appeared first on bellingcat.
Texte intégral (1568 mots)
This article is the result of a collaboration with The Sunday Times. You can find their corresponding piece here.
Sign up here to receive Bellingcat’s biggest investigations by email as soon as they are published.
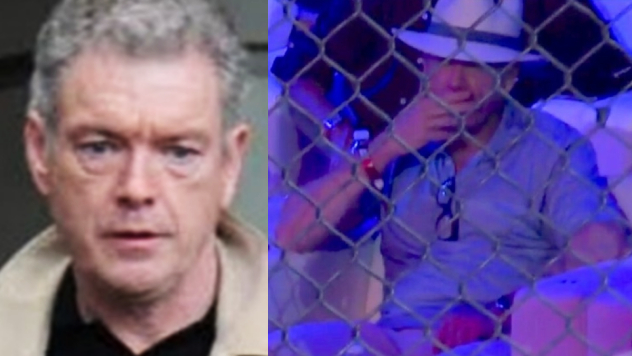
Christy Kinahan, the Irish founder of the Kinahan Organised Crime Group who is being pursued by authorities around the world from his bolthole in the United Arab Emirates (UAE), has had his residence permit cancelled.
The visa was cancelled at the end of last month, just weeks after the extradition of his eldest son Daniel Kinahan from Dubai to Ireland, where he is charged with directing the activities of a criminal organisation.

Support Bellingcat
Your donations directly contribute to our ability to publish groundbreaking investigations and uncover wrongdoing around the world.
It follows a review of public immigration records by Bellingcat and The Sunday Times, published in August, which revealed that Christopher Kinahan Jr, another of Christy Kinahan’s sons, was recently issued with a new two-year visa in the UAE.
This is despite his status as a sanctioned individual who, like his father and older brother, is the subject of a $5 million reward from the US government for information leading to his arrest or conviction.
Last month, we also exposed the residence statuses of the crime gang’s other sanctioned leaders who remain at large in Dubai. These include cartel lieutenant Bernard Clancy, whose residence permit was renewed in January, as well as padel poster boy Ian Dixon and Christy Kinahan, who have been living in Dubai on expired permits.
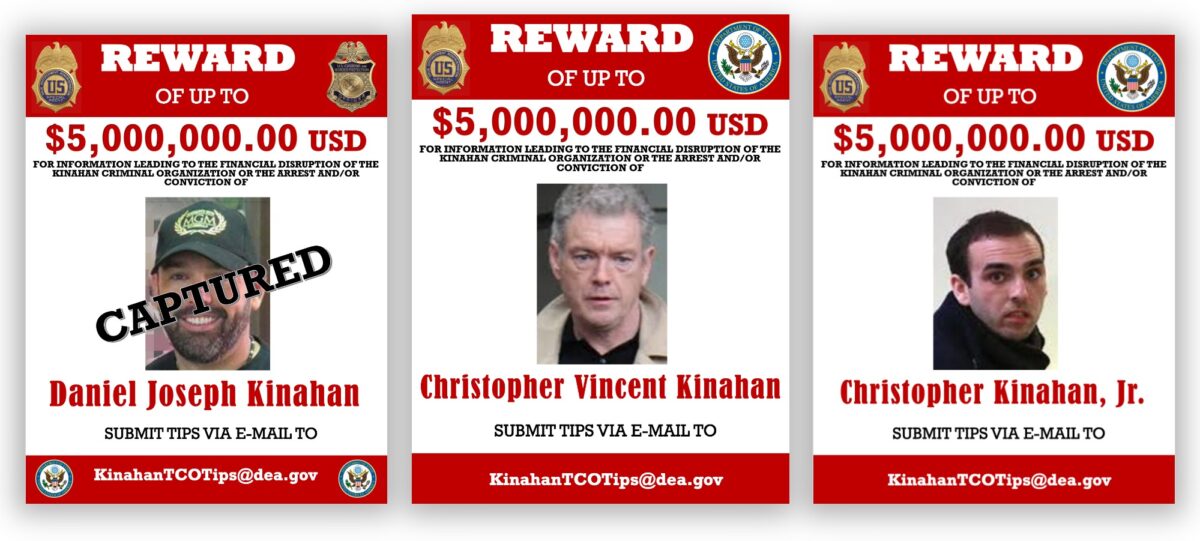
The cartel members had all obtained employment-based residence visas sponsored by Dubai companies, which are required to apply for employee work permits through the UAE’s Ministry of Human Resources and Emiratization.
Christy Kinahan’s most recent visa listed his employer as OSA Management Consultancies DWC LLC, which is based at the same Dubai address as cartel-linked firm CV Aviation Consulting Services DWC LLC. The visa expired on April 1.
A new search of Emirate government portals shows the visa was subsequently cancelled on August 31.
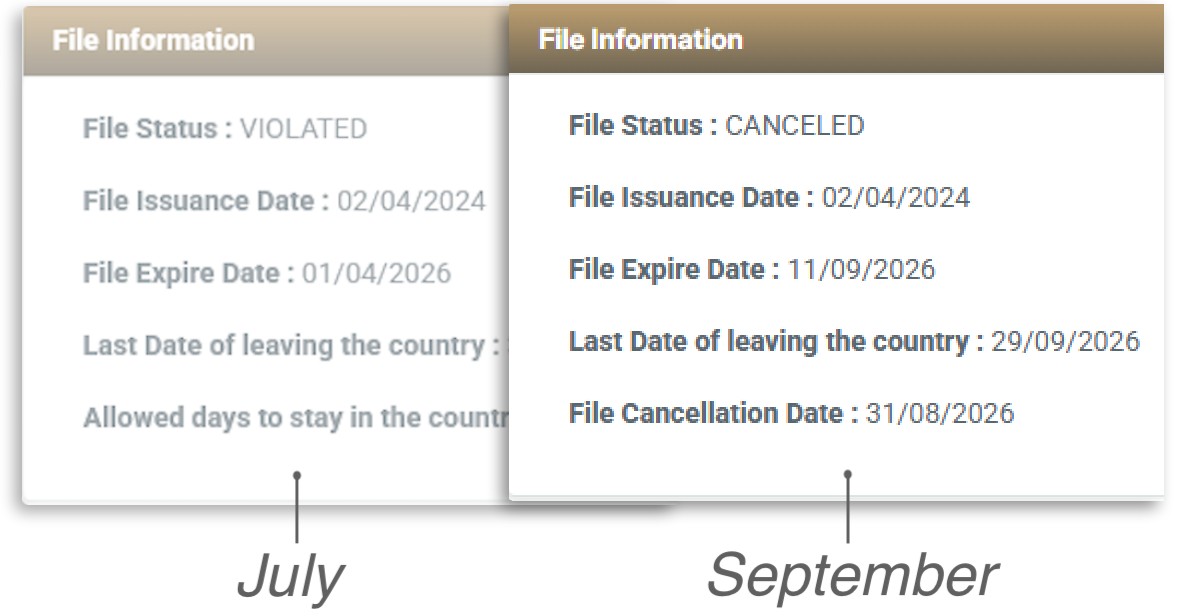
According to information published by a UAE government-authorized service provider, visa cancellation applies to people who leave the country permanently, alter their visa category or change employer. For employment-based residence visas, the cancellation process must be initiated by the employer or an authorised representative.

In the case of Kinahan’s visa, the specific reason for the cancellation is unknown. However, his last date for leaving the country is listed as September 29 in the government immigration file. This is in line with the 30-day grace period granted to holders of standard employment visas after cancellation.
The Sunday Times reports today that Europe’s intelligence services believe Kinahan is still in Dubai, though rumours that he has moved to Africa have sparked speculation he has already fled the Gulf. It also reports that the cartel leader has moved assets out of the Emirates as the crime group breaks into rival factions.
The Kinahan Organised Crime Group is a $1.5 billion transnational network involved in drug trafficking, money laundering and arms smuggling. Investigators have connected it to Iran’s intelligence services and the Lebanon-based militant group Hezbollah.
The UAE foreign ministry has been contacted for comment.
Connor Plunkett, Peter Barth, Beau Donelly and John Mooney contributed to this article.
Bellingcat is a non-profit and the ability to carry out our work is dependent on the kind support of individual donors. If you would like to support our work, you can do so here. You can also subscribe to our Patreon channel here. Subscribe to our Newsletter and follow us on Bluesky here, Instagram here, Reddit here and YouTube here.
The post Christy Kinahan’s UAE Residence Visa Cancelled appeared first on bellingcat.
16.09.2026 à 18:04
“A Recurring Pattern”: Civilians Paying the Price in Mali’s Drone Campaign
Sebastian Vandermeersch

Sign up here to receive Bellingcat’s biggest investigations by email as soon as they are published. WARNING: This report contains links to graphic images and footage. A joint Bellingcat and Jeune Afrique investigation into drone strikes carried out by the Malian military adds new details about the attacks which frequently are carried out in civilian areas and have […]
The post “A Recurring Pattern”: Civilians Paying the Price in Mali’s Drone Campaign appeared first on bellingcat.
Texte intégral (3462 mots)
Sign up here to receive Bellingcat’s biggest investigations by email as soon as they are published.
WARNING: This report contains links to graphic images and footage.
A joint Bellingcat and Jeune Afrique investigation into drone strikes carried out by the Malian military adds new details about the attacks which frequently are carried out in civilian areas and have reportedly resulted in the deaths of civilians.
The incidents, concentrated in northern Mali, often involved strikes on vehicles or commercial activity. Video footage of the strikes is often broadcast on national television, portrayed as precise attacks against terrorists and their logistics.
Mali’s military government acquired its first Turkish-made Bayraktar TB2 drones in late 2022, and regularly releases footage of drone strikes to be broadcast on national television, describing them as “precise” and describing the targets as “terrorists and their logistics”. This month marks three years since Mali joined with Burkina Faso and Niger to form the Alliance of Sahel States (AES). Its military government has made restoring national sovereignty a central part of its political message.
Support Bellingcat
Your donations directly contribute to our ability to publish groundbreaking investigations and uncover wrongdoing around the world.
Bellingcat geolocated more than a dozen drone strikes including instances in which civilian deaths and injuries were reported. However, this represents just a fraction of the strikes that have taken place in northern Mali, with many more conducted for which footage was not available or further details were harder to verify as the locations are so remote.
Yvan Guichaoua Senior Researcher at the Bonn International Centre for Conflict Studies told us the Malian military’s drone strikes appeared to fit a pattern of “guilt by location” in which people may be treated as targets based on where they are rather than who they are.
He added that the broadcast of drone strikes on national television, often accompanied by dramatic commentary created a familiar narrative for veiwers that was akin to daily episodes “of a national saga”. Yet the impact of the drone war on civilians and non-combatants is seldom covered in such reports.
Mali’s civil war involves separatist and Islamist groups and has been ongoing since 2012, predating the formation of the AES. But the conflict has spiked in 2026 as Tuareg separatists from the Azawad Liberation Front (FLA) and militants from the al-Qaeda affiliated Jama’at Nusrat al-Islam wal-Muslimin (JNIM) seized control of parts of the country’s north in coordinated attacks against the Malian military and Russia’s Africa Corps forces. The Malian military (known hereafter by their official name Forces Armées Maliennes or FAMa) has relied heavily upon drone strikes in response.
We contacted FAMa and put our findings to them but did not received a substantive response at time of publication.
Destruction in Zouera
In one notable case – on July 8, 2025 FAMa presented a drone strike in the town of Zouera, in the Timbuktu region, as a successful operation against a supply vehicle for terrorists in footage broadcast on ORTM1 [4:50-5:31]. Drone footage shows a person walking near the vehicle before it is struck. The explosion immediately ignites a nearby structure, while several people can be seen running away.
One video of this incident, apparently showing the aftermath of the attack, shows the remains of a person inside the burnt-down structure, which was located directly beside the vehicle that was hit in the strike. We also checked satellite imagery and found a noticeable burn scar at the location in imagery taken on Jul 9, 2025, that wasn’t visible the previous day.
Bellingcat geolocated the strike site to the coordinates 16.84589, -3.85213, inside Zouera. Several videos filmed in the immediate aftermath show the destroyed vehicle, a large plume of black smoke, and the nearby structure engulfed in flames.
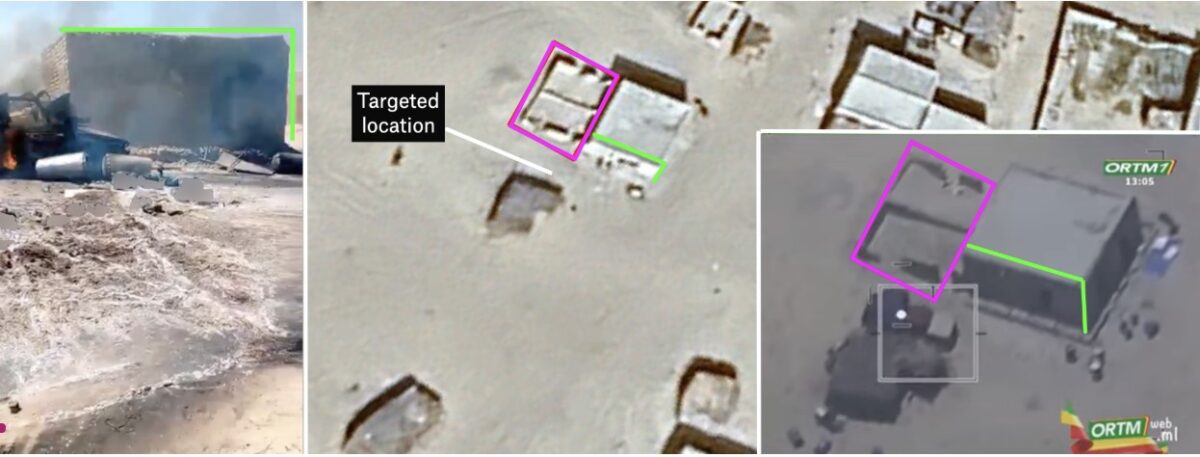
Information gathered by Médecins Sans Frontières (MSF) and posted on X on July 11, 2025, stated four people were killed in the strike, including three young girls. MSF added that five others were treated for injuries at a local health centre, one of whom was in a serious condition.
#Mali
— MSF Western & Central Africa (@MSF_WestAfrica) July 11, 2025: Après une frappe aérienne ayant touchée le marché de #Zouéra, cercle de Goundam, région de #Tombouctou, les équipes MSF ont pris en charge ce mardi 8 juillet 5 blessés, dont un cas grave, au centre de santé local. 4 personnes ont perdu la vie, dont 3 jeunes filles. pic.twitter.com/cTdLiY9bG8
Amasrakad Strike
Zouera was not an isolated incident. Footage from March 2024 that was released by the Malian military and again aired on ORTM1 showed two drone strikes in the town of Amasrakad that resulted in the deaths of civilians, according to witness testimony and previous reporting by Amnesty International.
The footage shows an initial strike hitting a parked pick-up truck before cutting to a second strike on a nearby compound, where several people can be seen running moments before impact. The first strike was geolocated to the coordinates 17.08402, 0.76204, by France 24.
Bellingcat geolocated the second strike to a structure within a nearby compound at coordinates 17.081613, 0.768012, where the drone footage shows several people scrambling before impact. Separate graphic footage published by the Spokesperson for the Awazad Liberation Front on X the following day shows several dead people including what appeared to be women lying in and around the compound. France 24’s previous reporting on the strike included images of covered bodies inside a destroyed tent, as well as an image of a child that was reportedly injured during the strike.
Our partner Jeune Afrique obtained testimony from the man who filmed the footage. He said the second strike killed 13 members of two families, including several children, who had gathered in a tent for shelter after the first strike. He added that he helped take eight injured people to health centres. The man told Jeune Afrique he has now joined the separatist FLA group following the attacks.
This testimony would appear to support a 2024 Amnesty International report that stated at least 13 civilians, including seven children, were killed and more than a dozen people injured. Amnesty reported speaking to seven survivors and eyewitnesses who said the first strike hit a Toyota Hilux used by the local health centre. Believing the vehicle had been the target, residents fled to a nearby compound to seek shelter. The second strike then hit the compound directly, the Amnesty report stated.
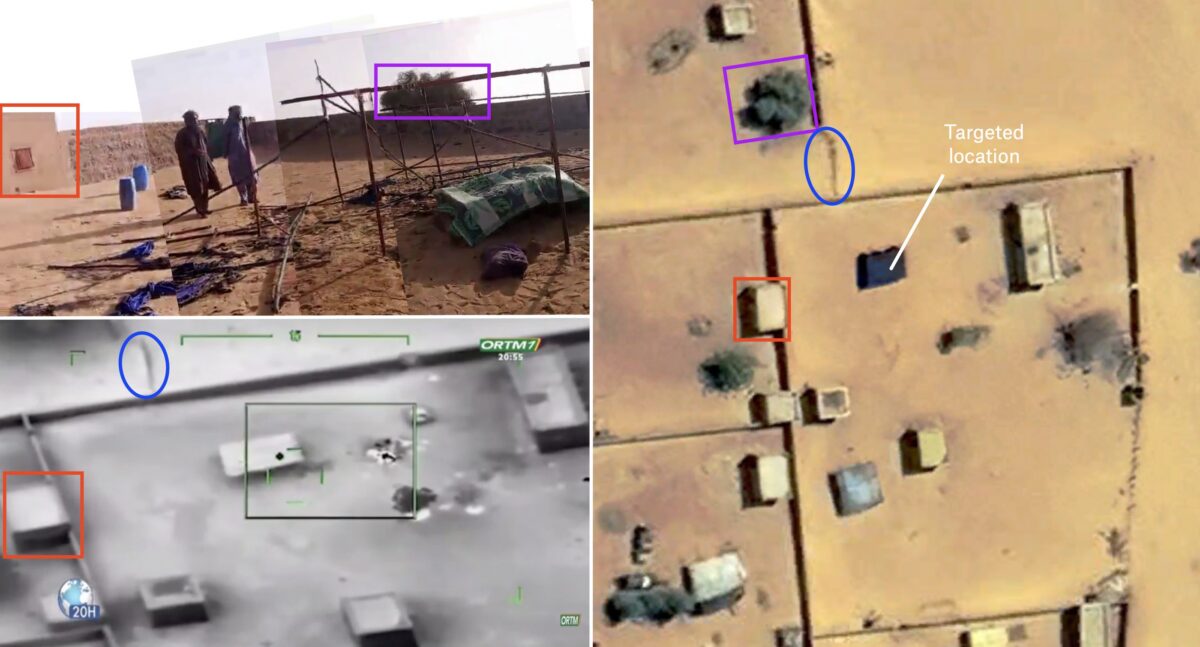
The FAMa claimed in an official statement just after that attack that: “These operations neutralised several terrorists and destroyed a significant quantity of military equipment and vehicles.” While the pro-Azawad separatist group, the CSP gave a different account, condemning the strikes and claiming that they had killed 13 of which a majority were women and children.
We contacted FAMa to ask whether it maintains that those killed were members of an armed group, whether steps were taken to establish if civilians were present before the strike was carried out and whether an investigation was done into the reports of civilian deaths. We did not receive a reply at time of publication.
Two Strikes in Tinzaouaten
Some of the cases we geolocated had been documented previously. However, we were able to add new details about several strikes. The town of Tinzaouaten near Mali’s northeastern border with Algeria endured two major drone strikes in 2024, reportedly in retaliation for a major assault carried out by separatist and Islamist forces against Malian troops and Russian mercenaries. On July 30, 2024, the Malian military stated it had launched an air campaign around Tinzaouaten in coordination with the military government of Burkina Faso and had targeted “high-value targets”, including caches, logistics hubs and vehicles.
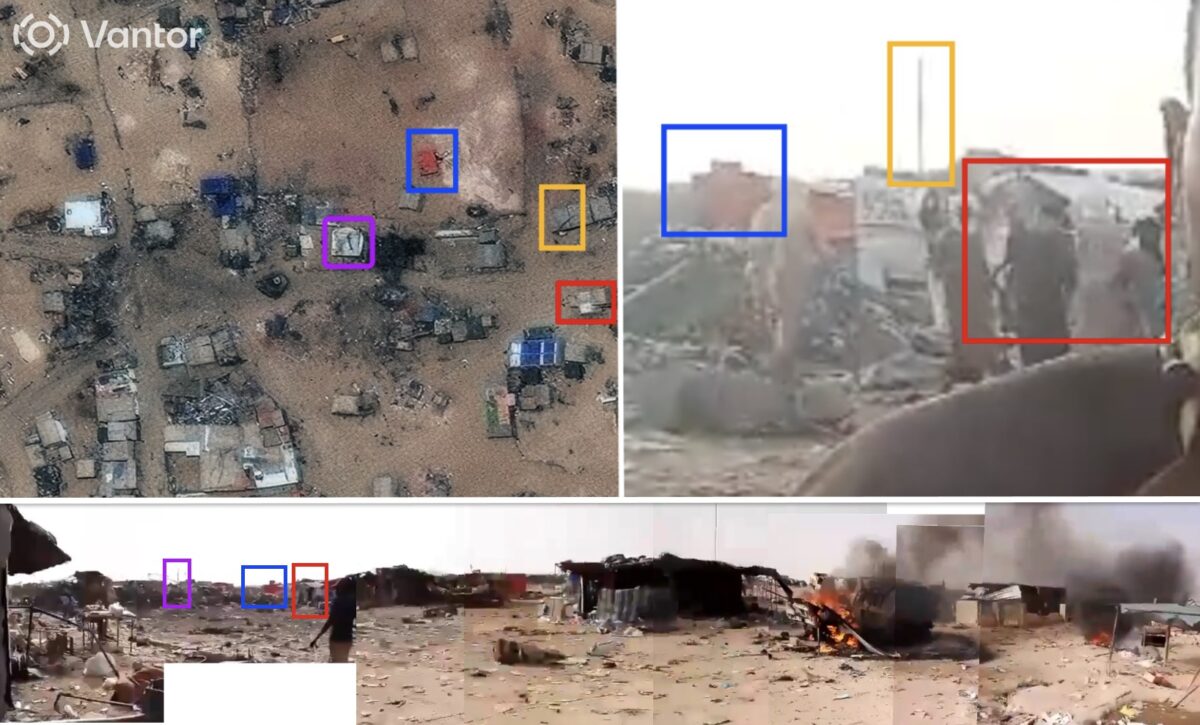
Bellingcat geolocated this footage posted on the day of the strike to 19.92476, 2.98003. The footage shows several damaged structures and what appears to be one casualty.
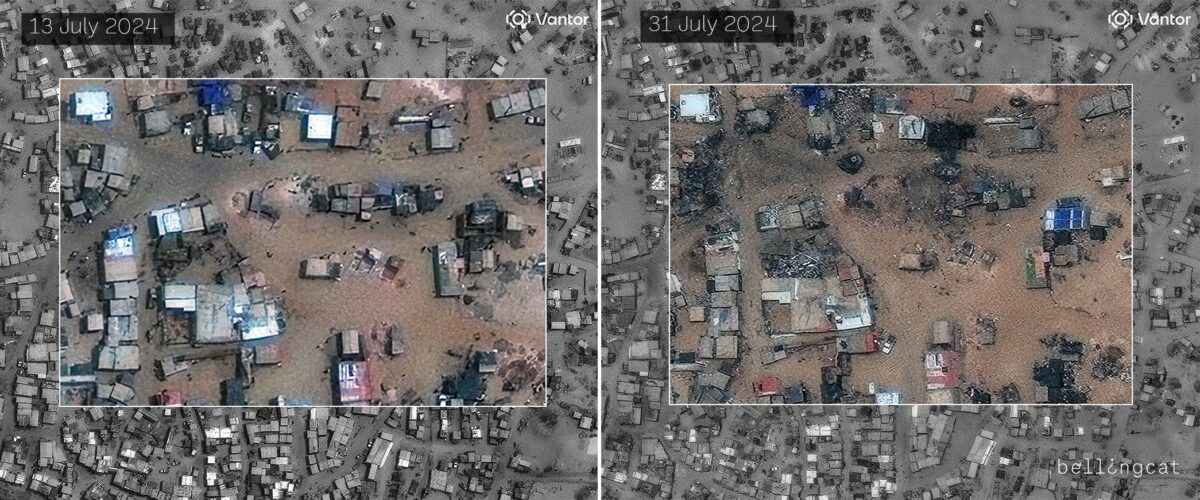
Pits and infrastructure which appear to be consistent with a mine are visible in satellite imagery of the area.
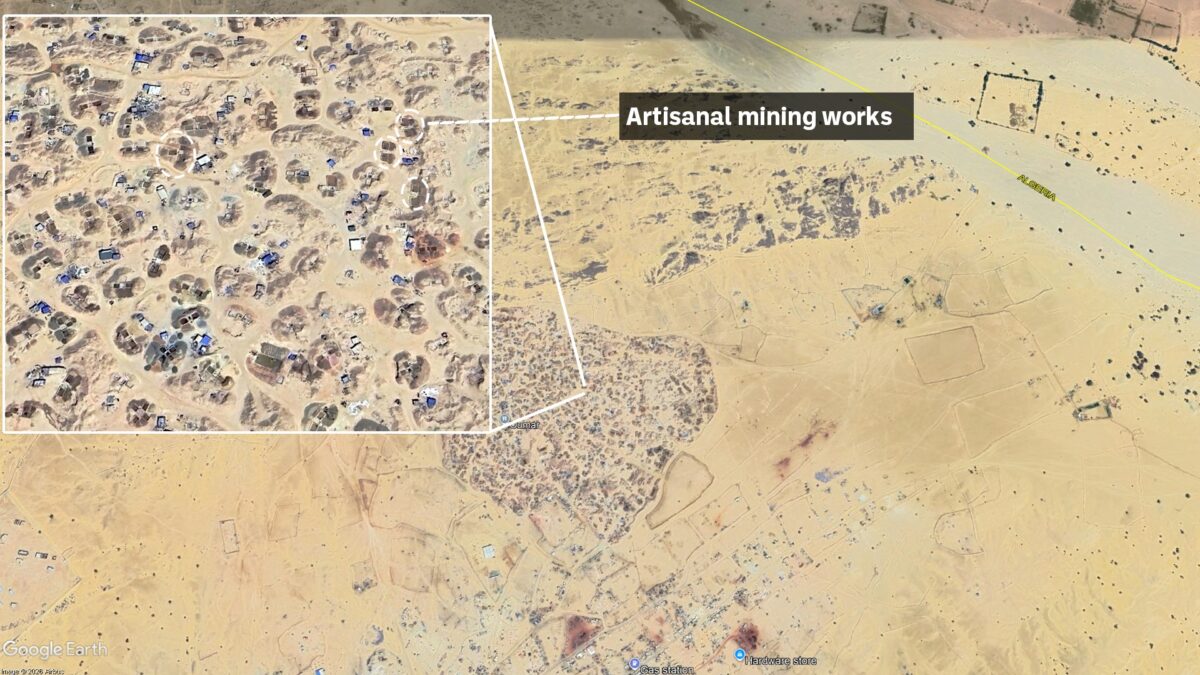
Bellingcat geolocated an additional video posted by a pro-Azawad media outlet showing destruction posted on X to the coordinates 19.92502, 2.98013. In another video geolocated to this site, a man claims he is at the “Inkharaban mine, near the Azawad-Algeria border.”
The Second Strike
A month later, on August 25, 2024, FAMa stated it had identified pickup trucks carrying military equipment in Tinzaouaten. It said that, “After careful surveillance, a series of strikes destroyed these terrorist targets and neutralized around twenty armed individuals.” On news channel ORTM1 the newsreader described the operation as “precision strikes targeting terrorist objectives”.
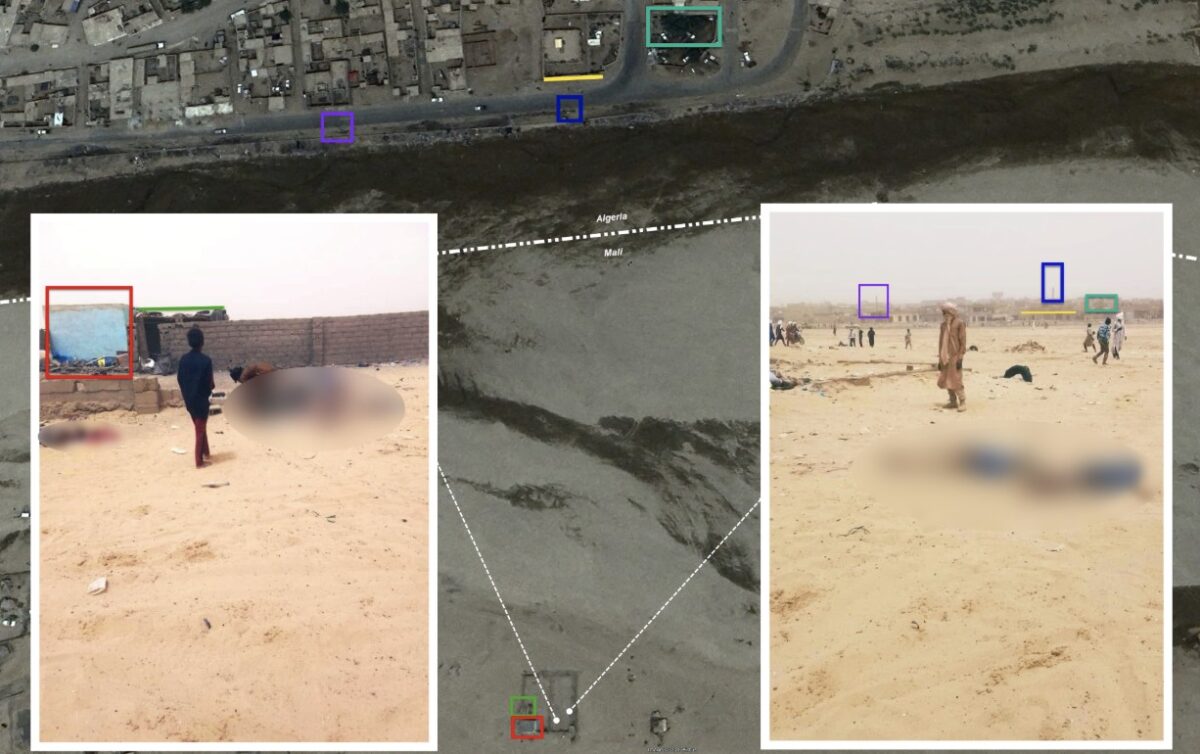
Bellingcat geolocated footage shared online by the pro-separatist Press and Media Agency of Azawad showing the destruction at the coordinates 19.95107, 2.97284, in Tinzaouaten.
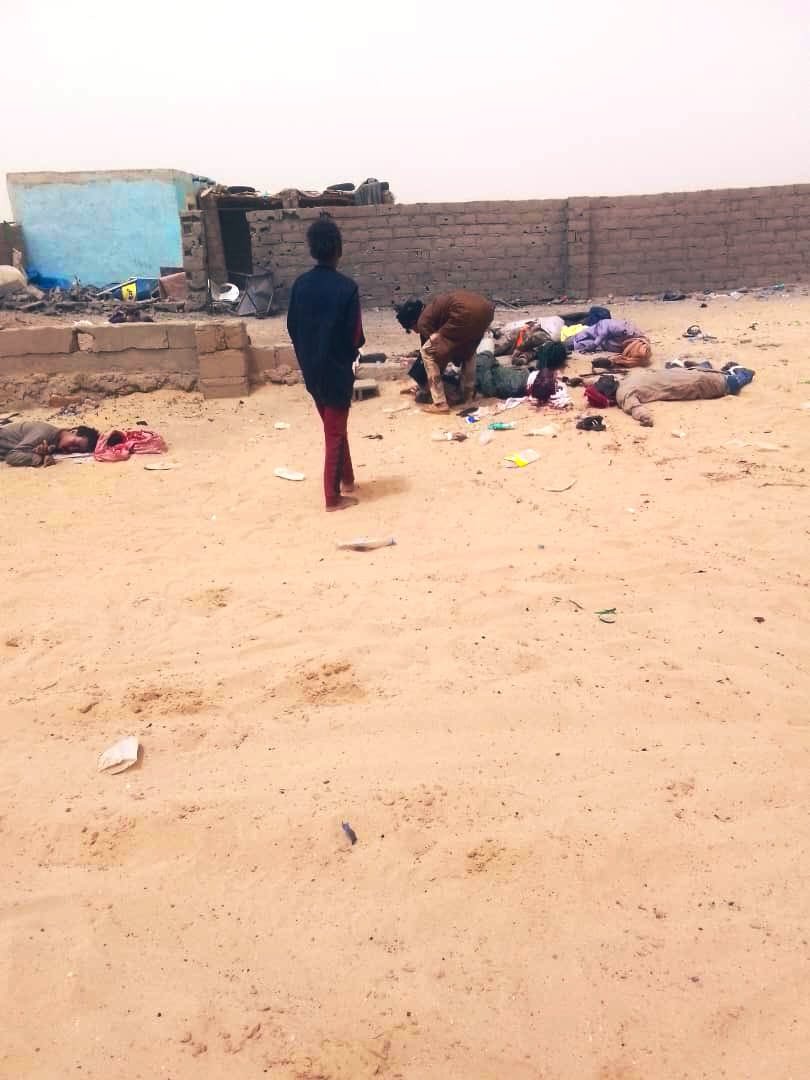
Bellingcat also geolocated two images showing casualties at this location. One image shows a group of around eight bodies, while another graphic image shows the bodies of two young boys around 20-meters away (19.9512, 2.97307). We could not confirm whether or not those pictured were civilians though a resident told Reuters that civilians were killed in drone strikes on the town.
Bellingcat contacted FAMa to ask about the two strikes in Tinzaouten in the summer of 2024. We asked the military what steps were taken to establish whether civilians were present when the strikes were carried out and whether any investigation has been carried out into the two strikes, but we had not received a response at time of publication.
In addition to the above incidents Bellingcat geolocated additional drone strikes based on footage broadcast on ORTM and added them to the below map. We were not able to confirm who was killed in the additional strikes but evidence we analysed show strikes often taking place within populated villages or against vehicles and fuel supplies.
14.09.2026 à 15:36
Bellingcat Official Merch Design Contest
Bellingcat Development Team
Guess what? Bellingcat is finally launching an official merch line! That’s right: after years of fantasizing and wishing, we’re finally ready to get our name and logo on cool merch that you’ll be able to show off. We’re working with a high quality, sustainable merchandising company to make all kinds of cool swag: coffee cups, […]
The post Bellingcat Official Merch Design Contest appeared first on bellingcat.
Texte intégral (1343 mots)

Guess what?
Bellingcat is finally launching an official merch line! That’s right: after years of fantasizing and wishing, we’re finally ready to get our name and logo on cool merch that you’ll be able to show off. We’re working with a high quality, sustainable merchandising company to make all kinds of cool swag: coffee cups, caps, t-shirts, hoodies, and more!
We want your help designing the merch!
It’s not a Bellingcat project if it doesn’t involve you, our community, and our official merch launch is no different. As part of this exciting launch, we’re asking you to submit design ideas for the merch.
Close your eyes and think “Bellingcat”. What do you see? Draw it, write it, paint it—get original and creative, and send it to us! We’re only interested in what you can come up with, so leave the AI at home.
Our staff will review your submissions and pick the ones that we like the most. We’ll score them on originality, creativity, and how well they reflect the Bellingcat essence. If we pick yours, we’ll let you know and give you free merch with your design on it!

How to submit your design ideas
To submit your design idea, simply upload an image via this Google Form. Once our staff reviews your submissions, we’ll conduct public voting to select the winning submissions. Our staff will let you know by November 6, 2026 if yours was one of the winning designs. We’ll then work with you to put the merch with your amazing design on it in your hands!
For more information on the terms and conditions of the contest, make sure to read this page. Please keep all submissions appropriate for a general audience. Content containing profane, lewd, explicit, discriminatory, or harassing material will be rejected immediately without review.
The last day to make your submission is October 2, 2026.

Please see our FAQ below:
Who owns the design?
If your submission is selected as a winning entry, you agree to transfer all commercial, intellectual property, and copyrights worldwide to Bellingcat Stichting. To legally formalize this transfer, winning entrants will be required to sign a separate deed of transfer under Dutch law. However, you shall retain your moral rights under Dutch law, including the right to be acknowledged as the author of the work. If your design is not selected, you retain full ownership of your artwork. By submitting an entry, all participants grant Stichting Bellingcat a non-exclusive, worldwide, royalty-free license to display and share the artwork solely for the purpose of promoting the competition, conducting public voting, and reviewing entries.
Are you accepting AI-generated submissions?
No thank you, we are looking for human-designed creations!
Will I get paid for my submission?
If your design is chosen and you have provided your contact details, you’ll receive an exclusive voucher code which will cover the purchase of a product of your choice that features your design.
Will Bellingcat make money on my design?
Any profit from merchandise sales will go towards the Bellingcat Stichting Foundation, which will help us run our operations and keep our investigations independent.
How long will winning designs be in circulation?
This design submission is for a limited time capsule event. The designs chosen will only be available until the limited stock lasts.
What do you mean by a sustainable print on demand company?
The platform we’re using to create the merchandise is Fourthwall, which offers many sustainable print on demand providers.
Who will select the winning designs?
Bellingcat staff members will shortlist the initial submissions and then the public will be given the opportunity to vote on the final selection of designs and products which will be anonymised. The ones that receive the most votes will be selected for production.
What level of effort do I need to put in here? I’m not a professional artist!
Don’t doubt yourself! We want to see where your creativity takes you. Submissions are evaluated as creative concepts; final execution, text layout, and color formatting will be finalized by our production team. Bellingcat Stichting and its printing partners reserve the right to modify or adjust the design strictly to ensure compatibility with apparel printing processes, manufacturing standards, and brand guidelines. However, we will respect your moral rights as the author and will not make substantial alterations that harm the integrity of the original work without your prior consultation and consent.
What makes a winning design?
We will use three categories to score designs out of five. The three categories designs will be marked on are: originality, creativity, and speaks to our collective mission.
Can I submit more than one entry?
Brimming with ideas? You can submit more than one design to the contest. To do so, either combine multiple designs into one file, clearly labelling them as separate concepts, or fill out the form separately for each design.
The post Bellingcat Official Merch Design Contest appeared first on bellingcat.
31.08.2026 à 14:58
Investigating a Murder: Public Records Uncover New Clues in Chinatown Cold Case
Peter Barth
Sign up here to receive Bellingcat’s biggest investigations by email as soon as they are published. On a June night in 1996, in a basement apartment in Boston’s Chinatown, a killer put a pistol to the back of a young man’s head and pulled the trigger. The victim’s body was wrapped in quilts, lowered into the trunk of […]
The post Investigating a Murder: Public Records Uncover New Clues in Chinatown Cold Case appeared first on bellingcat.
Texte intégral (5868 mots)
Sign up here to receive Bellingcat’s biggest investigations by email as soon as they are published.

On a June night in 1996, in a basement apartment in Boston’s Chinatown, a killer put a pistol to the back of a young man’s head and pulled the trigger. The victim’s body was wrapped in quilts, lowered into the trunk of a car and driven about 20 miles southwest of the city, where it was dumped in the woods. It lay undiscovered through two New England winters until a dog walked home carrying a human bone.
For three decades, authorities did not release the victim’s name to the public. He is listed in the National Missing and Unidentified Persons System (NamUs) as #UP12385, one of 202 unidentified people recorded in the state of Massachusetts. The circumstances of his discovery are reduced to five words: “Skeletal remains found in woods.” The case remains unsolved.
Bellingcat spent more than a year investigating in an effort to put a name to the victim. Using open sources, including freedom-of-information requests and newspaper archives, as well as interviews with investigators who worked on the case, we pieced together the story of the man’s life and death in an era before the internet kept a digital record. In total, we submitted 27 public records requests to 18 local, state and federal law enforcement agencies. We also contacted more than two dozen investigators, prosecutors, crime victims, journalists, experts and community groups connected to the case, though most said they did not recall the 30-year-old murder.
We learned that authorities identified the victim as Fu Chun Wang, a 26-year-old undocumented Chinese immigrant who did not speak English. We also learned of a sweeping investigation into Chinese organised crime in New England in the late 1990s. Authorities suspected Wang was a member of the Fukienese Flying Dragons, a gang the FBI described at the time as a “violent offshoot” of the larger Flying Dragons crime ring.

Based in New York’s Chinatown, the Fukienese Flying Dragons were active across much of the East Coast. The gang trafficked migrants, extorted and robbed businesses, kidnapped for ransom and murdered rivals. Authorities believed Wang belonged to the Boston faction of the group, which was suspected of carrying out home invasions targeting Asian and Asian-American restaurant owners and staff across New England in 1996.
Heavily redacted FBI documents and correspondence between local and state authorities show that a federal operation investigating the home invasions uncovered information about Wang’s murder and other crimes. The operation, whose name is redacted, was led by the US Attorney for the District of New Hampshire.
Authorities suspected that the Boston-based members of the Fukienese Flying Dragons were also involved in prostitution, illegal gambling and kidnappings in multiple states. Investigators examined possible ties between the gang and a suspect in one of Boston’s deadliest mass killings: the 1991 Chinatown Massacre.
According to these newly released files, investigators received information that Wang had been murdered by members of his own gang shortly after Boston Police arrested and charged him for using credit cards stolen in one of the home invasions. While some gang members were identified as suspects and investigated, none were ever charged and convicted for the murder.
A Dog with a Bone
On April 10, 1998, a resident in Sharon, an affluent suburb southwest of Boston, called the police. Their black Labrador retriever had returned from the woods carrying a large bone. Four days later, testing by the coroner’s office in Boston determined it was a human femur likely belonging to an adult male. Police searched the woods, where a detective uncovered more bones near a bundle of quilts. Inside, they found a decomposed skeleton.
A coroner ruled that the victim was a man in his twenties or thirties who was possibly Asian or Native American. He had long black hair with blonde streaks. There were at least two overlapping bullet holes in the back of his skull. Local media reported at the time that the victim had been shot “execution style”. A single, corroded .380 calibre shell casing was found inside the quilt. The victim was wearing a green-and-white striped rugby shirt, denim jeans and white leather sneakers on the night he died. Loose change, a pocket knife and a tarnished set of keys were found nearby on the forest floor.
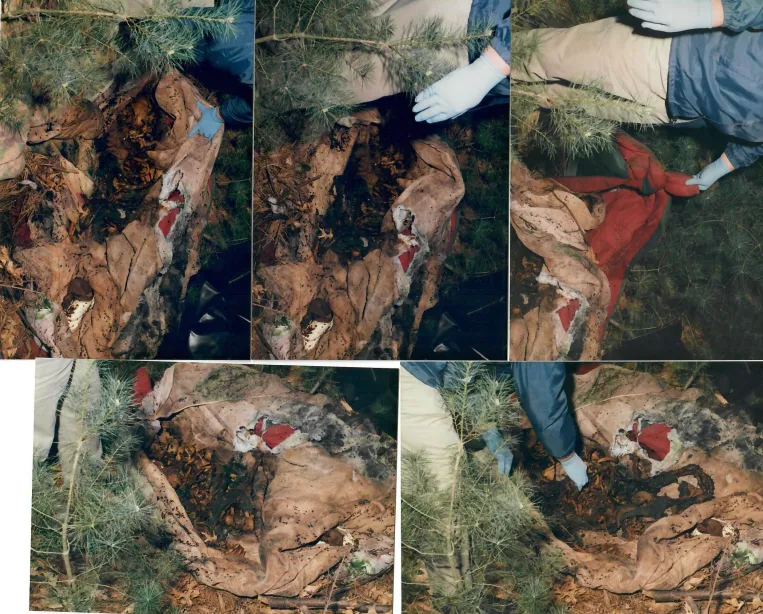
A botanist from Harvard University determined the body had likely been in the woods for at least 18 months. Experts from The Smithsonian Institution told police that forensic facial reconstruction would be “of questionable value” due to the damage caused by the gunshot injuries.
Before his murder, open source records of Wang’s life amounted to a few scattered data points: interactions with authorities, apartment rentals, a loan application and a hospitalisation following a car accident.
Police reports after his death show investigators pieced together a patchy collection of biographical data. He was from a family of five in Dongshan, a village in the southeastern Chinese province of Fujian, and was likely born into poverty. During his autopsy, it was noted that his teeth showed signs he had been “undernourished” as a child. He moved to the US to work in the restaurant industry and eventually joined a gang.

Wang migrated at a time when thousands of Fujianese were arriving in the US every month in search of a better life. Like many migrants at the time, he entered the country without documentation. By 1994, when Wang met with immigration authorities in Boston, he gave his address as an apartment on East Broadway in New York’s Chinatown. Two years later, he was issued an employment authorisation card. Boston Police would learn from the Immigration and Naturalisation Service (INS) that Wang had been granted political asylum.
Search results on Ancestry.com suggest that prior to living in Massachusetts, Wang had also lived in Virginia and Vermont. Records from the Sharon Police Department corroborate these findings. In Virginia, police learned that he worked in restaurants and had applied for a loan to buy a car, a 1994 green Mitsubishi Mirage.
In Vermont, Wang worked at a Chinese restaurant called Men-at-Wok until he was injured in a car accident in May 1996. After he was reported missing a month later, his car sat unclaimed in an auto body shop in Vermont until a bank sought to reclaim it.

Unclaimed checking and savings accounts at Fleet National Bank are listed under Wang’s name and the Quincy address in the Massachusetts unclaimed property database. The amount of money in these accounts is not publicly available, but the presence of unclaimed funds in his name, along with his abandoned car, are some of the many indicators that he met with foul play.
‘We’ll Kill Your Family’
In the summer of 1996, Chinese restaurant owners and their staff in suburban Boston and New Hampshire were terrorised by a wave of violent home invasions and robberies. Police described the suspects as “an organised group of Asian individuals”.

The modus operandi was often the same. In the early morning hours, young men barged into rooming houses while Chinese restaurant workers slept. Sometimes they robbed the business owners’ homes. Armed with guns and knives, the intruders tied up their victims before stealing cash and valuables. One woman who was attacked at knifepoint told police an assailant threatened: “Shut up or I will kill you”. In another case, a victim was stabbed.
The assailants were described as young men or teenagers. In several cases, victims reported that they spoke Fuzhou, also known as Foochow, a language originating from eastern Fujian Province.
Jim Keating, a retired Sharon Police detective, told Bellingcat that many Asian gang extortions and robberies in the Boston area at the time were not reported. “They were all afraid of these guys, because they said, ‘We’ll come back and we’ll kill your family.’ And they would.”
In the span of a few months in 1996, similar robberies occurred in the Massachusetts towns of Bedford and Westborough, as well as Malden, a city about 10 kilometres north of Boston. These were followed by home invasions in the bordering state of New Hampshire, in Wolfeboro, Merrimack, Lebanon and Manchester. It is unclear if the home invasions and robberies were connected, but Bellingcat’s review of historic newspaper clippings and newly released police documents suggest that at least one other gang may have been responsible for some of the crimes.
In response to the crime spree, local, state and federal law enforcement agencies coordinated investigative efforts. Bellingcat obtained files detailing a federal operation led by the US Attorney for the District of New Hampshire. It included agents from the FBI, INS, Drug Enforcement Administration, Bureau of Alcohol, Tobacco, Firearms and Explosives, Customs Service, Border Patrol and Royal Canadian Mounted Police, along with officers from state, county, and local law enforcement agencies in New England.

Ben Leong, a retired Boston Police detective, said Asian gangs committing robberies, extortion and home invasions against restaurant owners and their staff were common in the 1990s. He said many of these crimes went unreported for cultural reasons, over fears of gang retaliation, and because victims did not trust law enforcement.
“Back then there were many factions of gangs,” he said. “The gang members were recruited throughout the country, nationally and internationally. Law enforcement was always playing catch up to identify the prevalent groups, and the individual members and leaders committing illegal activity.”
Leong, who is president of the International Organisation of Asian Crime Investigators and Specialists (IOACIS), said authorities had a better understanding of gang culture in Boston by around 1996 when local, state and federal agencies began sharing information.
Murdered in Chinatown
On June 9, 1996, one day after a home invasion in Wolfeboro, New Hampshire, Boston police were called to a Macy’s department store when a man tried to use credit cards stolen in the robbery to buy jewellery and electronics. He was arrested and booked on charges of receiving stolen property. The man was Fu Chun Wang.
Support Bellingcat
Your donations directly contribute to our ability to publish groundbreaking investigations and uncover wrongdoing around the world.
In Sharon Police records, Wang was described as “very depressed” and “possibly suicidal”. He told a Boston Police detective that he urgently needed to send $1,000 to his family in China. Other records said his father was ill and needed money. Files found on Judyrecords.com, a free database that purports to include more than 770 million US court case records, show that Wang was arraigned and a court appointed a defence attorney to him. He was bailed out after pleading not guilty.
Less than two weeks later, on June 21, Wang was reported missing to the Quincy Police Department in Massachusetts. The police report said Wang was last seen in Boston’s Chinatown on June 13, two days after he left jail. Police records indicate that a female friend of Wang’s had asked an attorney to file the missing persons report. The attorney who reported him missing told Bellingcat that he did not remember Wang.
The Sharon Police Department’s murder case file notes that within weeks of finding the human remains in the woods, they received information from Boston Police and the FBI that “Wang was murdered in Chinatown” in June 1996 and “his body [was] never found”.

Not all documents were released to Bellingcat, and some names were redacted. Fragmentary notes and witness statements provide the only clues to Wang’s final days. In handwritten records, Sharon Police said a man who was described as the “head of [an] Asian gang in Boston” had Wang killed over the New Hampshire breaking-and-entering incident.
A note in the Sharon Police file described a witness to Wang’s murder as a “Flying Dra” and a “NY gangster”. Retired detective Jim Keating confirmed to Bellingcat that Wang, along with his associates and killer, were suspected members of the Fukienese Flying Dragons. He said he believed Wang was murdered because he posed a risk to the gang following his arrest.

Documents released by the Merrimack Police Department and Sharon Police Department said that an inmate in New York who, in 1997, was serving a 25-year sentence for attempted kidnapping, offered to share information about Wang’s murder with the FBI in return “for a reduction (sentence)”. The inmate implicated the gang in at least two 1996 New Hampshire home invasions and also gave authorities information about the murder.
The account is heavily redacted but includes a note that the US Attorney for New Hampshire was making arrangements to interview the man. Police in New Hampshire said they believed the inmate “was truthful in his statements and has knowledge about the murder of Mr Wang”. Keating confirmed to Bellingcat that he and investigators from other law enforcement agencies traveled to New York to interview the man. He said the inmate, a suspected member of the Fukienese Flying Dragons, gave a statement on Wang’s murder.
Keating said that investigators had learned of a dispute on the night of the murder between Wang and the gang’s leader. He said Wang had planned to run an illegal gambling operation at an apartment, which the gang boss was using as a prostitution venue. This led to an argument at another location, and when Wang left for the apartment the boss followed him.
But Keating said that based on the information gathered throughout the investigation, he believes the primary motive for Wang’s murder was his arrest over the use of credit cards stolen in the Wolfeboro home invasion. With that arrest, Wang presented a risk to the rest of the gang because investigators could tie them to the home invasions. “Wang broke the basic rules by taking something that was identifiable and using it, and that’s what the whole damn thing was about,” Keating said.

Keating told Bellingcat that the crime scene had been damaged by flooding after the murder. He said he used a power saw to cut off the bottom of a door in the unit and that lab testing revealed the presence of Wang’s blood.
Investigators also worked to confirm Wang’s identity by testing the DNA of the remains found in the woods. In a 1999 case summary written by a Massachusetts State Police Trooper, it was noted that the FBI was attempting to locate Wang’s parents through police in China.
Three months later, the FBI’s Hong Kong office sent a communique to Boston confirming that the Chinese Ministry of Public Security and Interpol had located Wang’s parents. Wang’s mother, it said, was willing to provide a DNA sample for comparison.
The FBI communique is the final document in the newly released files that details the efforts to confirm Wang’s identity with DNA. However, Keating told Bellingcat that a DNA sample was obtained from Wang’s mother in China. It was brought back to the US for testing and confirmed to be a match, he said. “I don’t know when the DNA was collected or who did it. But I know that they did that,” Keating said. “There is no question about who he was.”
Bellingcat contacted both the Norfolk and the Suffolk County District Attorneys to confirm the DNA match, but did not receive a response to questions about DNA testing or the victim’s identity. Other former law enforcement officers named in the files released to Bellingcat have not responded to requests for comment.
One document included in the murder file references discussions between homicide investigators and the FBI about charging Wang’s killer with home invasion offences. The note discusses the potential to have a witness testify against Wang’s suspected killer. It is unknown whether he was ever charged.
The Shooter
The man authorities suspected of shooting Wang, or ordering his killing, was described in the documents as the head of the Fukienese Flying Dragons in Boston. Police said he was an undocumented immigrant from Fujian Province who ran a sex trafficking ring.
A redacted note in the Sharon Police Department murder file references Wang’s suspected killer as “a player” in the Chinatown Massacre, an infamous 1991 case in which five men were shot dead in a basement gambling parlour in Boston. In another note in the case file, investigators wrote that he was “thought to be a federal informant”.
The name of the gang boss was redacted in the police file released to Bellingcat.

Keating said Wang’s identity was confirmed by DNA and that blood evidence, corroborated by witness statements, placed his killing in the Boston Chinatown apartment. The retired Sharon detective said at that point, the Boston Police Department and the Suffolk County District Attorney’s Office should have, respectively, taken over the investigation and prosecution of the case.
The Boston Police Department did not respond to questions from Bellingcat. It does not include the killing in its list of unsolved homicides.
The Suffolk County District Attorney’s Office said it did not have records for Wang’s murder. “Unfortunately, after a thorough search with assistance from our homicide unit, no responsive records could be located,” it said.
In response to Bellingcat’s original public records request, the Norfolk County District Attorney’s office, which covers Sharon, said the files were exempt from public disclosure because they pertained to “an active and ongoing criminal investigation”.
A spokesman for the office said last week that the circumstances surrounding the remains of an adult male discovered in Sharon in April 1998 “remain under investigation” by a state police detective assigned to the Norfolk District Attorney’s Unsolved Case Unit.
The FBI confirmed that the agency assisted state and local partners in an operation investigating home invasions in the late 1990s but did not answer questions about Wang’s murder or his suspected killer. “Given that we’re not the lead, we’ll refer you to Massachusetts State Police,” a spokeswoman said.
Massachusetts State Police referred questions to the Suffolk and Norfolk County District Attorney’s offices.
It remains a mystery why Wang’s killer was never charged and prosecuted for his murder. “They got away with so much. Blatantly got away with so much,” Keating said of the gang. “Killing people for these guys was like … these guys were all expendable.”
The Norfolk District Attorney’s Office encouraged anyone with any information about the case to contact the Massachusetts State Police Tip Line or the Sharon Police Department.
Melissa Zhu contributed research to this article.
Bellingcat is a non-profit and the ability to carry out our work is dependent on the kind support of individual donors. If you would like to support our work, you can do so here. You can also subscribe to our Patreon channel here. Subscribe to our Newsletter and follow us on Bluesky here, Instagram here, Reddit here and YouTube here.
The post Investigating a Murder: Public Records Uncover New Clues in Chinatown Cold Case appeared first on bellingcat.
25.08.2026 à 10:52
Tracking a Sanctioned Russian Vessel’s West African Odyssey
Bellingcat Investigation Team
Sign up here to receive Bellingcat’s biggest investigations by email as soon as they are published. A sanctioned vessel that was previously reported to have transported weapons destined for Russian mercenaries has been traversing ports on the west coast of Africa since March, exhibiting what experts told Bellingcat was an unusual set of movements and behaviours. Patria (IMO: […]
The post Tracking a Sanctioned Russian Vessel’s West African Odyssey appeared first on bellingcat.
Texte intégral (5027 mots)
Sign up here to receive Bellingcat’s biggest investigations by email as soon as they are published.
A sanctioned vessel that was previously reported to have transported weapons destined for Russian mercenaries has been traversing ports on the west coast of Africa since March, exhibiting what experts told Bellingcat was an unusual set of movements and behaviours.
Patria (IMO: 9159921) has been sanctioned by the US, Ukraine and Canada.
Support Bellingcat
Your donations directly contribute to our ability to publish groundbreaking investigations and uncover wrongdoing around the world.
Radio France International (RFI) reported last year that it was one of two ships to deliver weapons to Conakry in Guinea that were intended for the Kremlin-controlled Africa Corps and their operations in Mali.
Satellite imagery and Automated Identification System (AIS) data from Lloyd’s List Intelligence shows Patria has shuttled between the Port of Douala in Cameroon and the Port of Owendo in Libreville, Gabon four times since March.
It has also twice stopped in anchorage off the coast of Lagos, Nigeria: first in March and then again at the time of publication. Analysis shows the vessel also spent time in anchorage off the coast of Equatorial Guinea.
The online news site, Modern Ghana, first reported Patria’s presence off the coast of Lagos in July after X-users @SONNAROW_OSINT and @RFNOSBlog picked up on Patria’s position.
It is not clear what Patria has delivered or picked up at these ports. Nor is it clear why it has spent so long going back and forth between them. But experts Bellingcat spoke to said the unusual patterns of behaviour raised numerous questions.
Charlie Brown, a former US Naval Officer and Senior Advisor at United Against Nuclear Iran said the combination of Patria’s repeated regional port calls, extended periods at anchor, and an apparent absence of a normal point-to-point trading cycle warranted scrutiny, especially as the ship is under sanction and is previously reported to have shipped arms.
Tracking the Patria
Patria is a cargo vessel that has a distinct shape and features. Its bridge is located on the bow and it has a bright red deck that contrasts with its blue hull and two yellow cranes.
At the end of the deck, the ship has a built-in ramp for vehicles (the Patria is a so-called roll on/roll off, or RoRo, vessel that is designed to transport wheeled vehicles). Its chimney is located next to the ramp.
This, in combination with the length of the ship (101 m), allowed Bellingcat to pick the vessel out in satellite imagery. AIS data helped us further track its long journey which began in the Sea of Japan, in Russia’s far-east, in January.
For the most part, we were able to match Patria’s AIS position with corresponding satellite imagery. We found no evidence of obvious spoofing incidents (where a ship intentionally broadcasts misleading AIS data) by the vessel during its months-long voyage, however, there were some instances where satellite images were not available and thus spoofing by the vessel cannot be completely ruled out.
Port of Olga, Russia
AIS data indicates that Patria loaded at the Port of Olga in the Sea of Japan between Jan. 21 and 23. Patria can also be seen on satellite imagery on these dates.
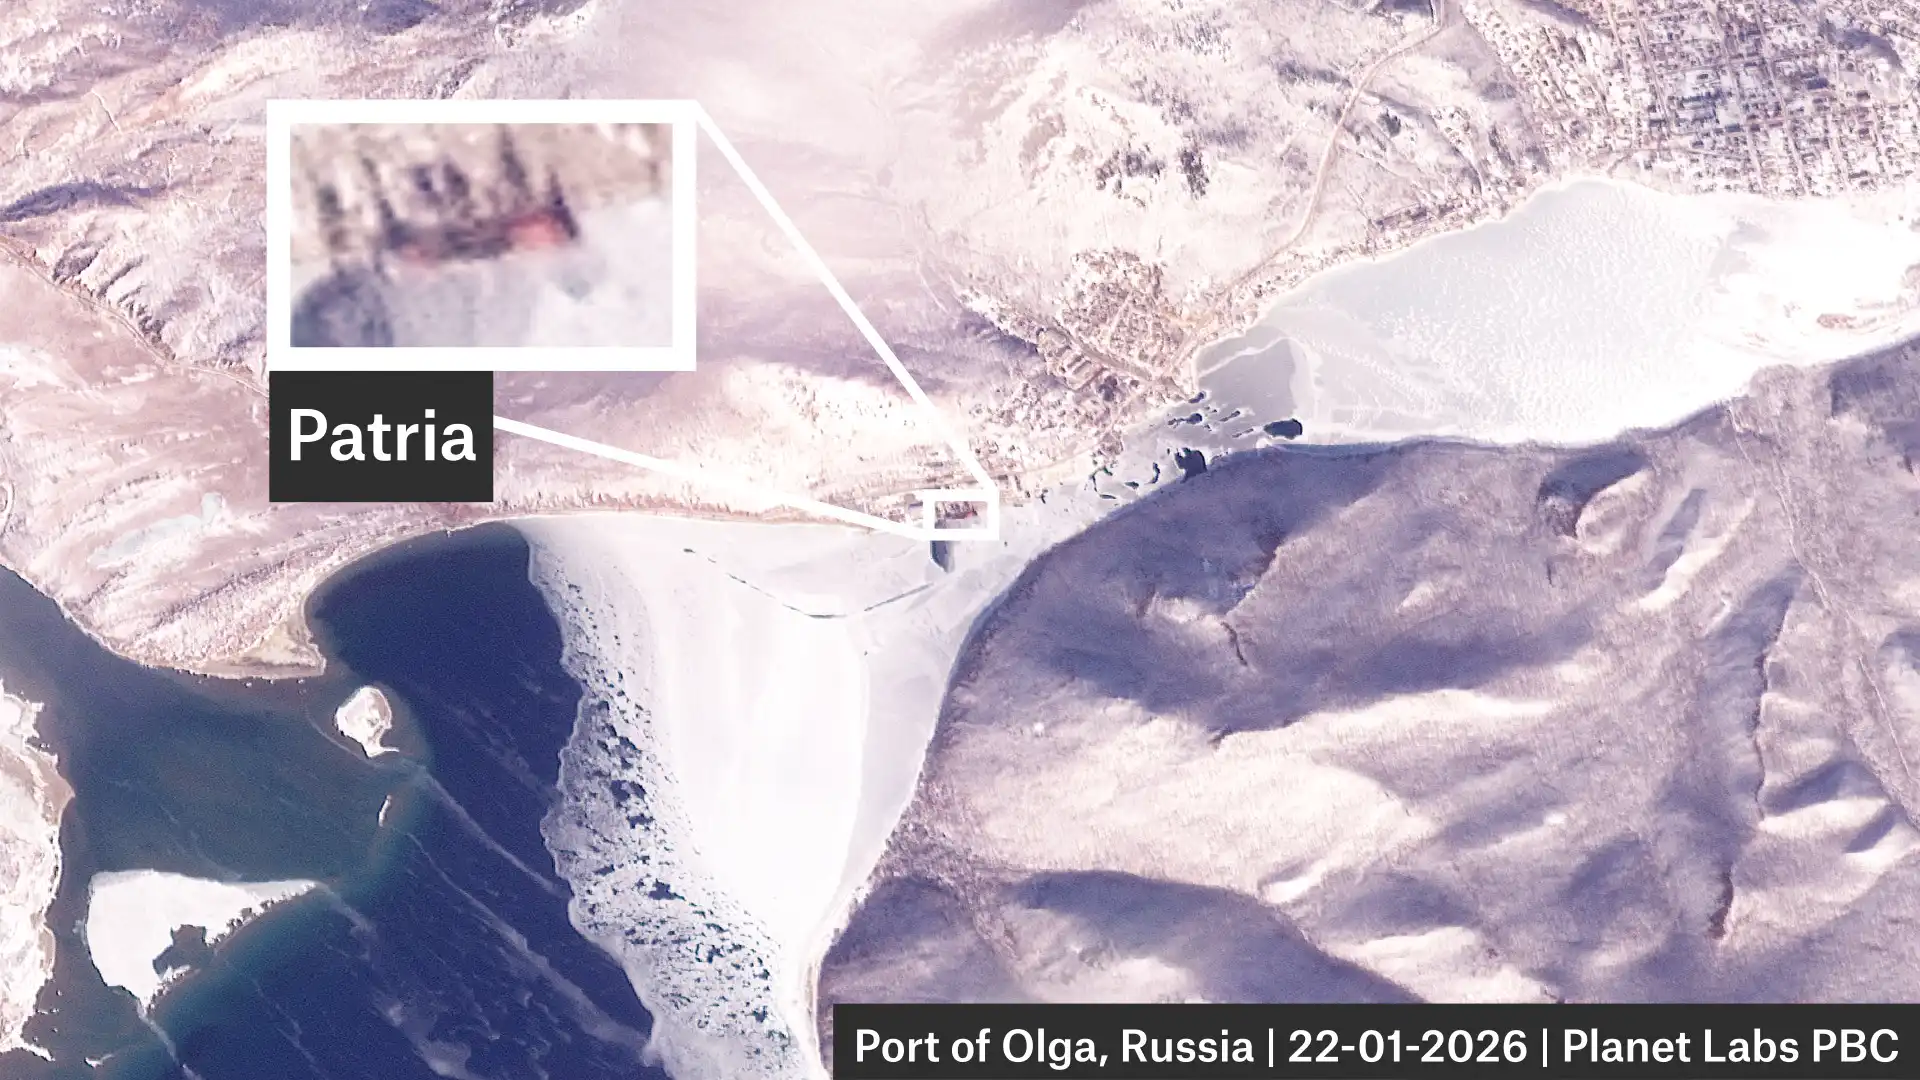
Credit: Planet Labs PBC.
Port of Douala, Cameroon
AIS data indicates that Patria unloaded some cargo in the Port of Douala between Mar. 11 and 12. Again, the ship can also be seen in satellite imagery on these dates.
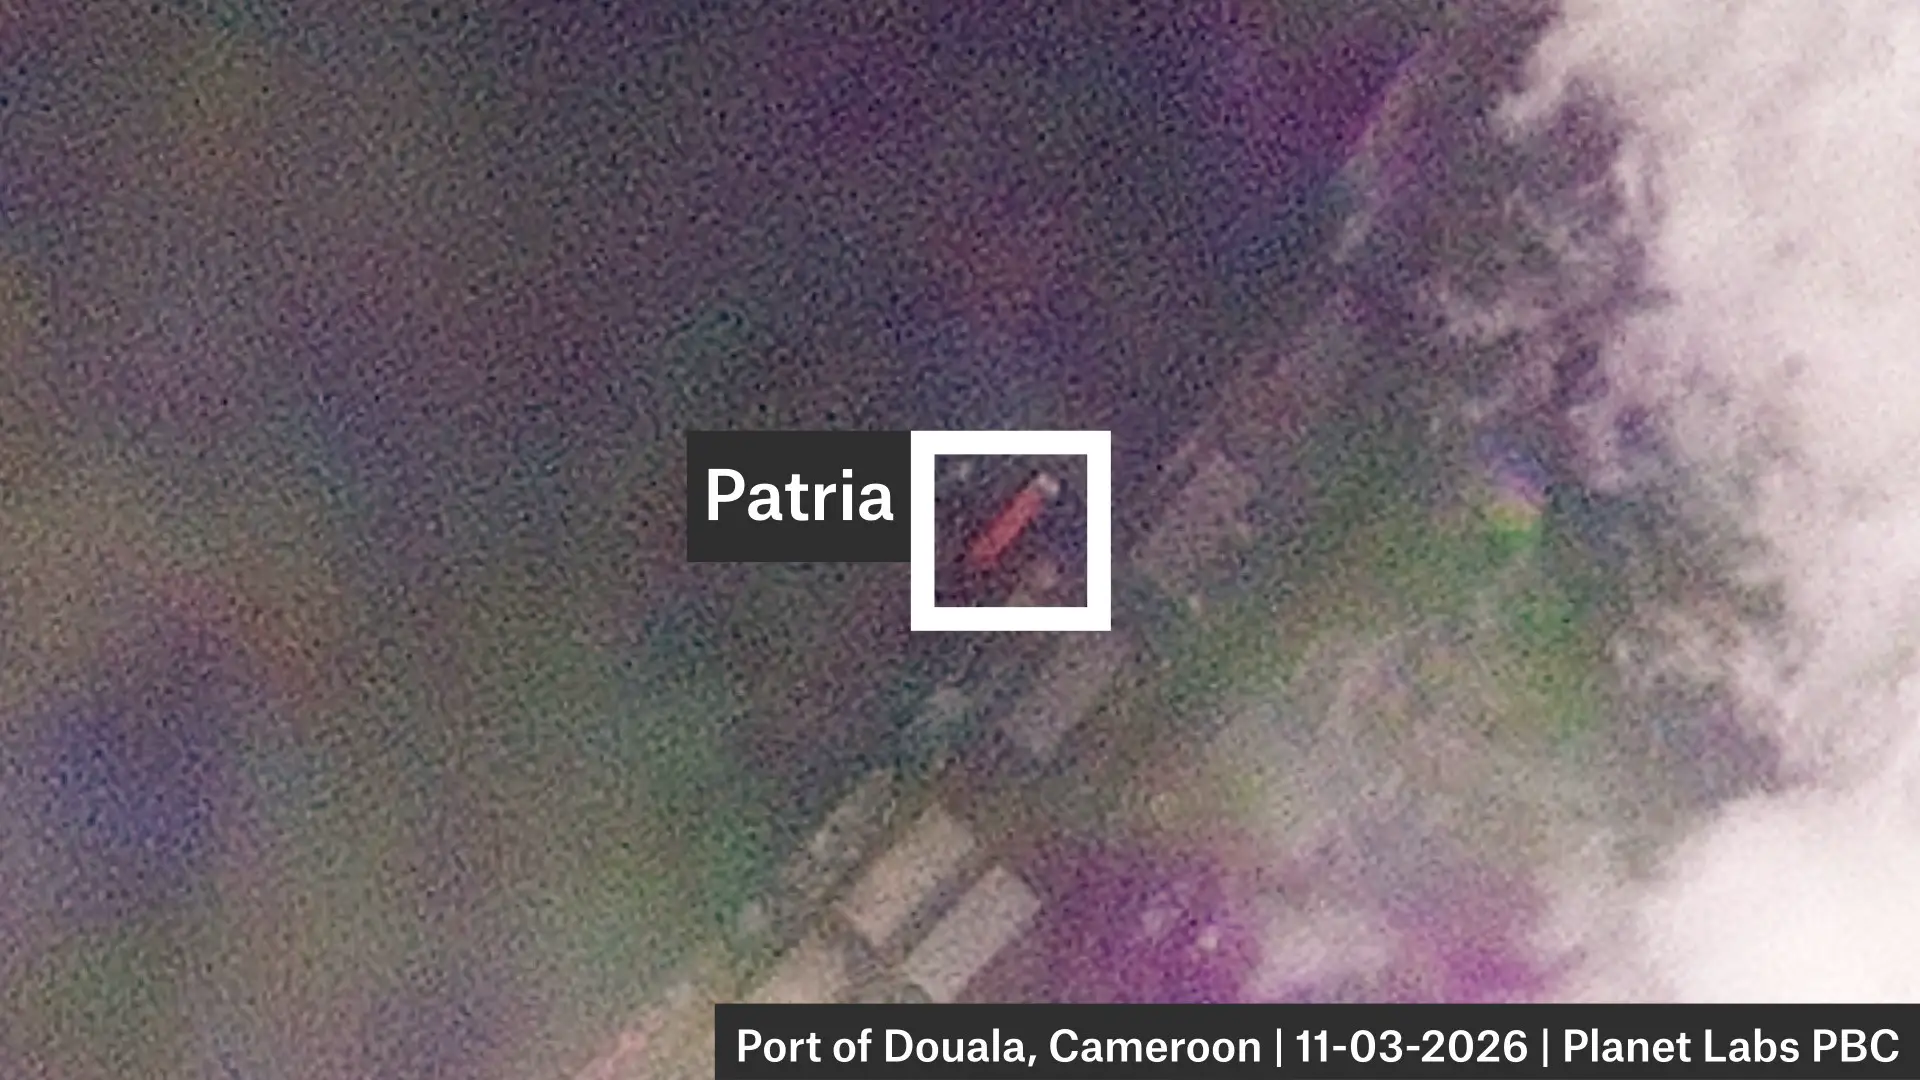
Credit: Planet Labs PBC.
Lagos Anchorage, Nigeria
AIS data indicates Patria anchored off the coast of Lagos from Mar. 14 to 15.
A Sentinel-2 image from the 15th appears to show another ship next to Patria. AIS data indicates that this is JS Gratitude, a bunkering tanker. This close proximity suggests that Patria was refuelling.
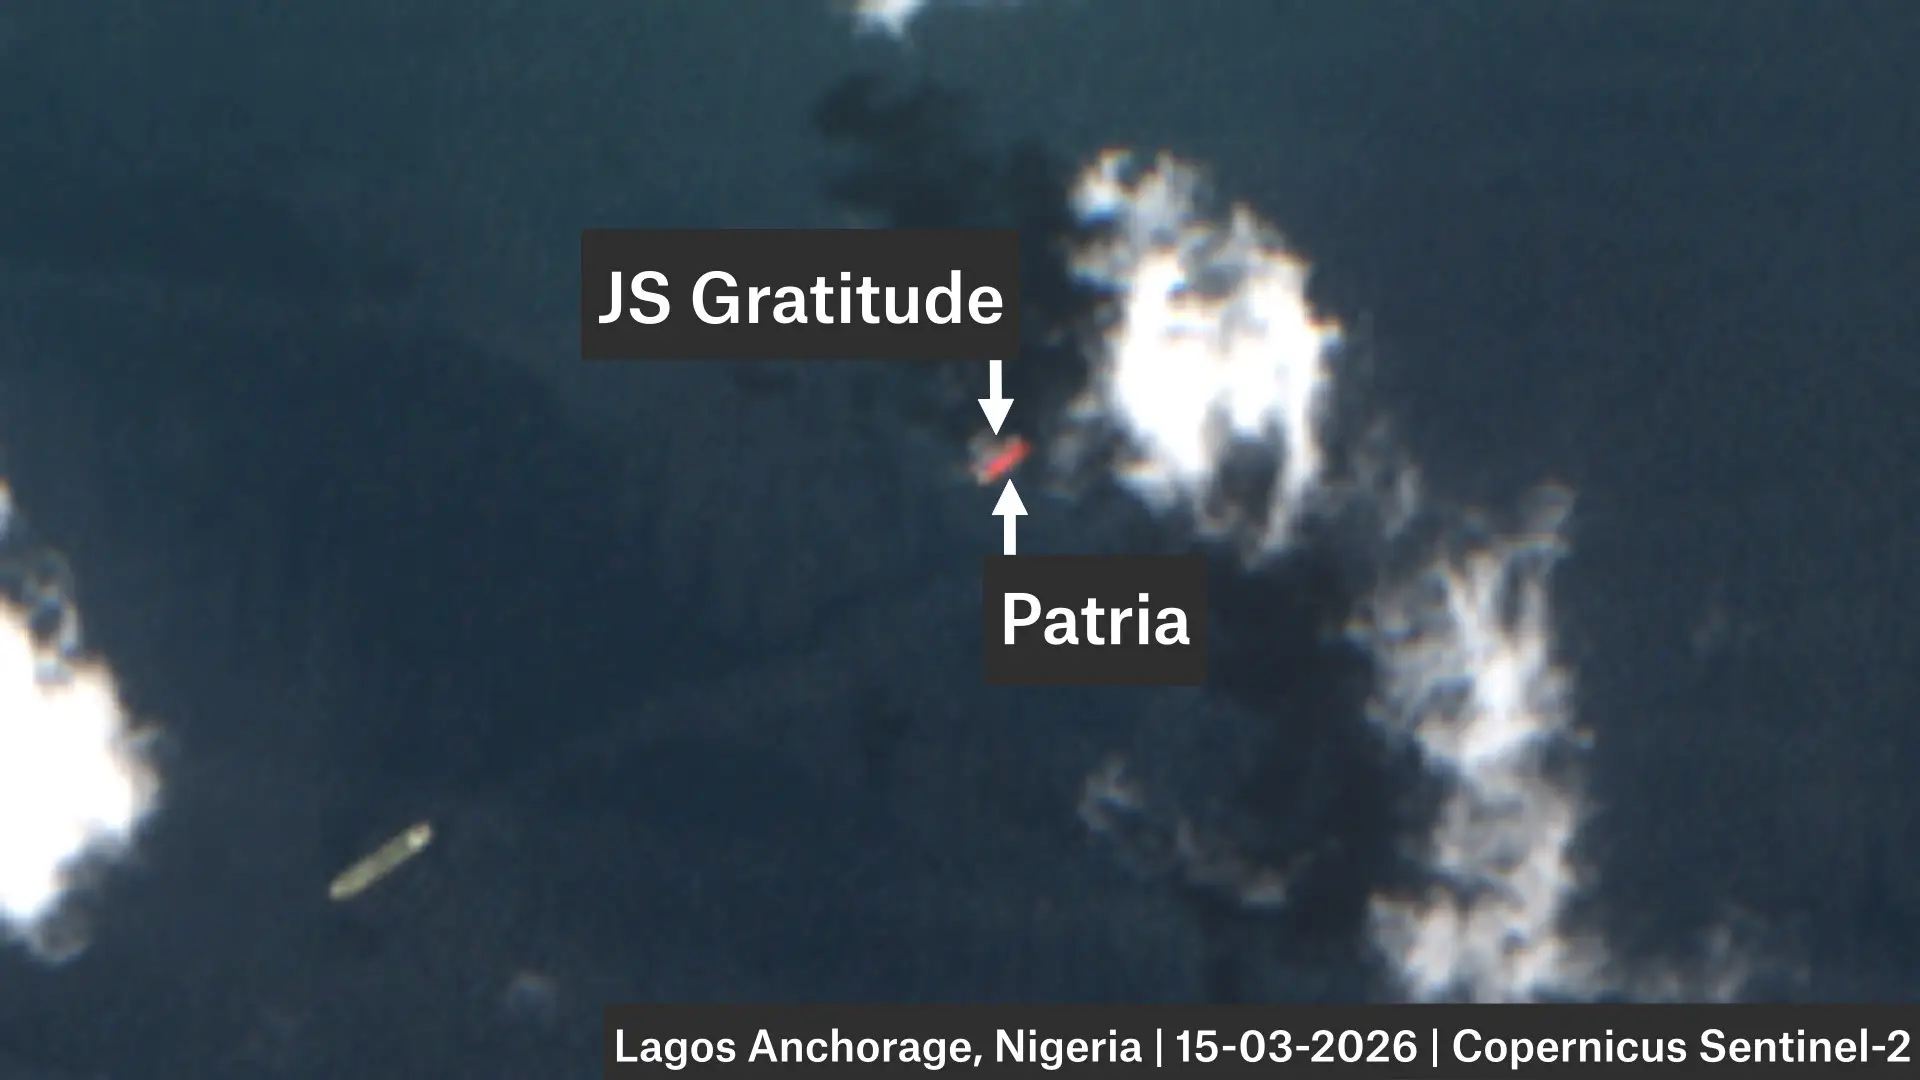
Bata Anchorage, Equatorial Guinea
AIS data and satellite imagery indicate Patria stayed off the coast of Equatorial Guinea for several days.
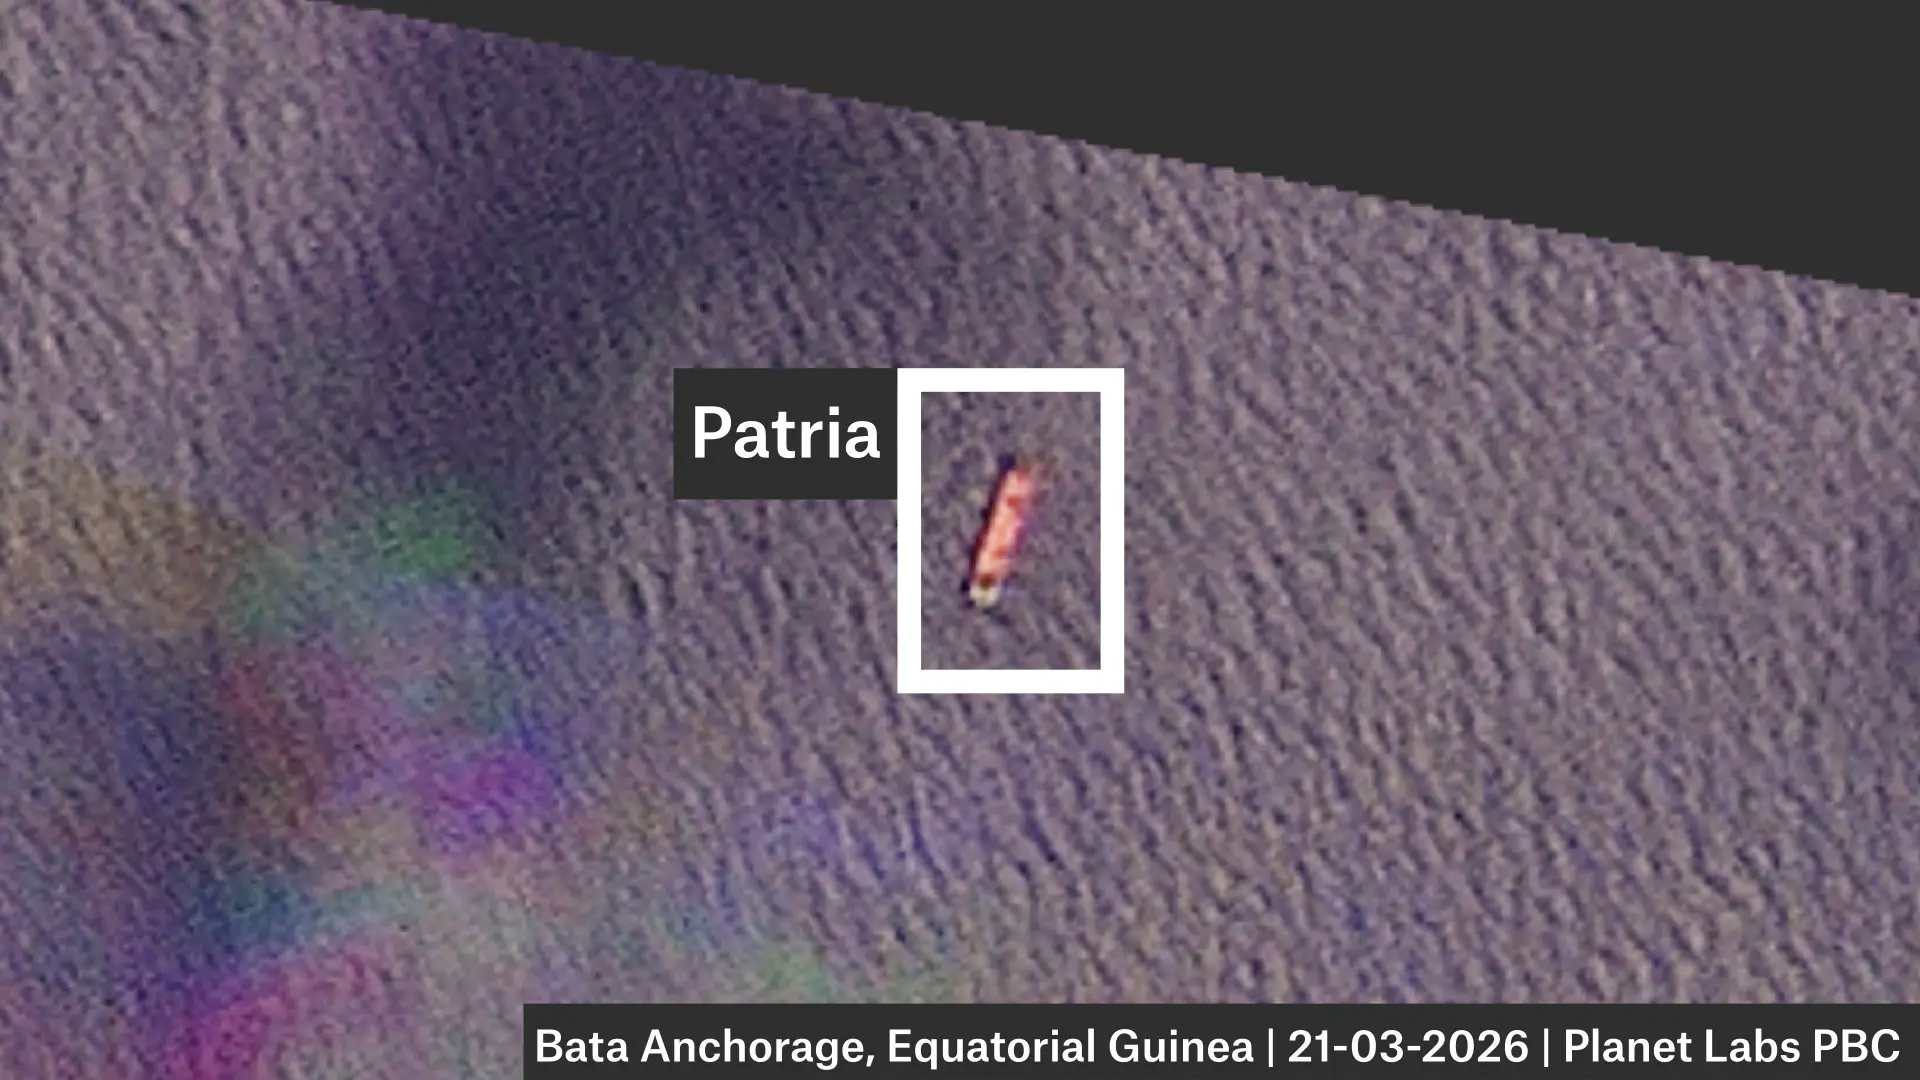
Credit: Planet Labs PBC.
Port of Owendo, Libreville, Gabon
AIS data and satellite imagery indicate Patria loaded at the Port of Owendo in Libreville after spending a few days off the coast.
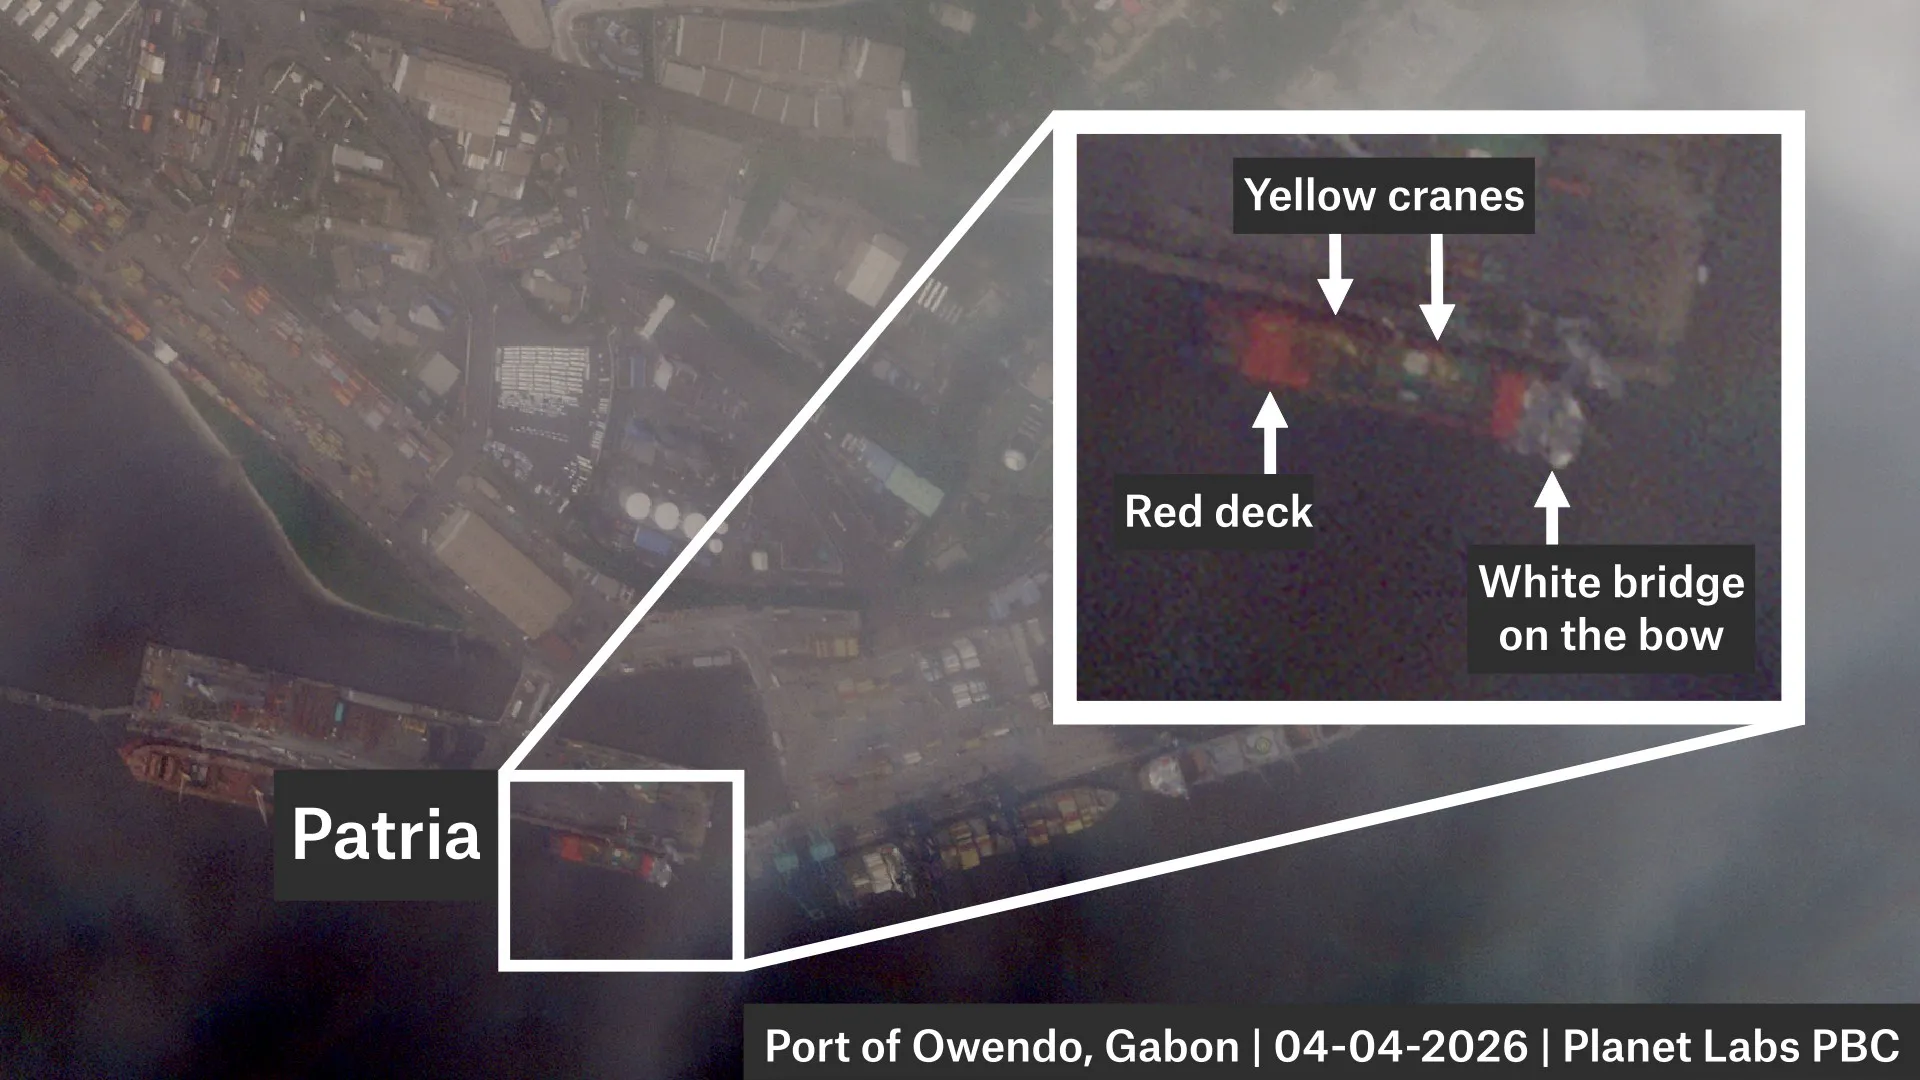
Credit: Planet Labs PBC.
Port of Douala, Cameroon
AIS data and satellite imagery indicate Patria stayed at the Douala Anchorage from Apr. 6 to 14, before unloading at the Port of Douala between Apr. 14 and 18.
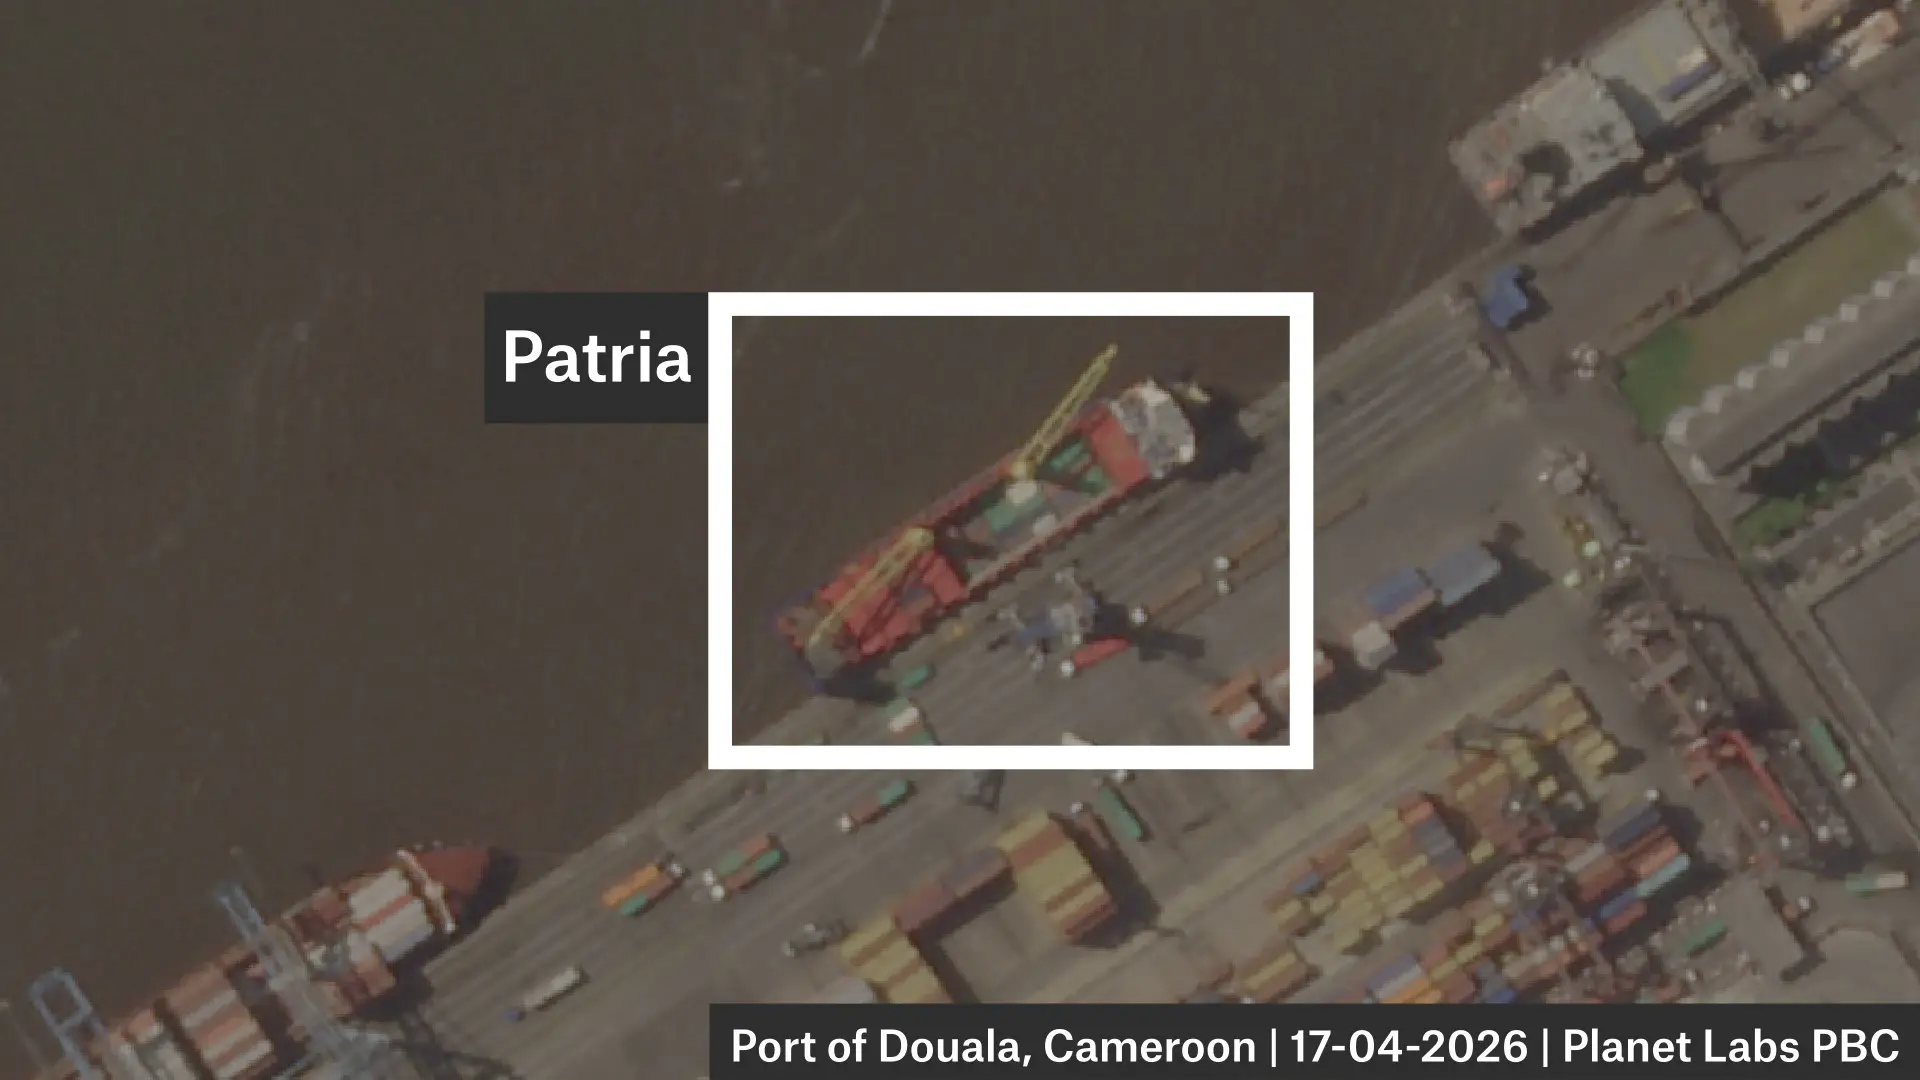
Credit: Planet Labs PBC.
Port of Owendo, Libreville, Gabon
AIS data suggests Patria loaded in Libreville again between Apr. 22 and 26.
Port of Douala, Cameroon
AIS data, supported by satellite imagery, indicates Patria stayed at the Douala Anchorage for nearly a month from Apr. 27 to May 21 before unloading in Douala from May 21 to 27.
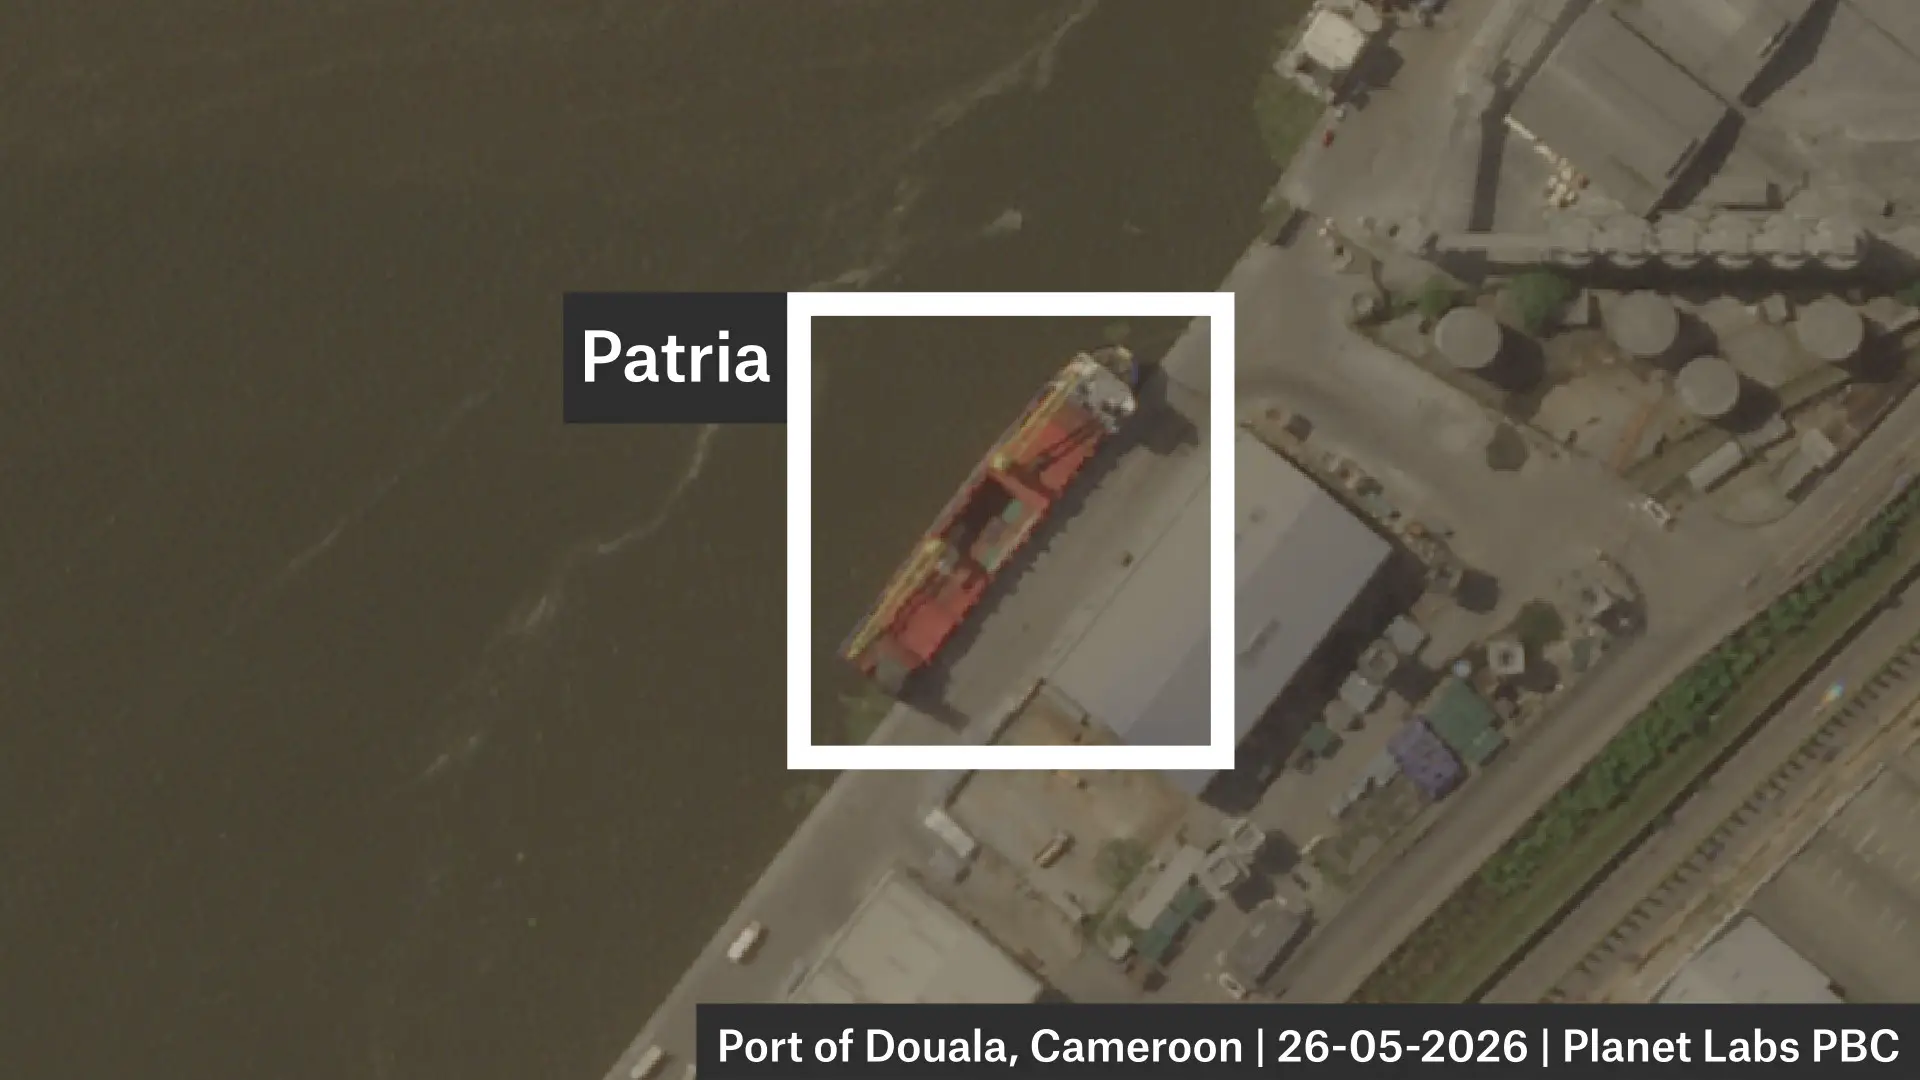
Credit: Planet Labs PBC.
A third trip between the Port of Owendo, Libreville to Douala, Cameroon
AIS data indicates, after nearly a month’s wait in Douala anchorage, Patria again loaded at Owendo before returning to Douala to unload.
A fourth trip between the Port of Owendo, Libreville to Douala, Cameroon
AIS data indicates Patria again loaded at Owendo before returning to Douala to unload.
Lagos Anchorage, Nigeria
AIS data indicates, after a short visit to the Libreville anchorage, Patria anchored off the coast of Lagos where it remained at the time of publication.
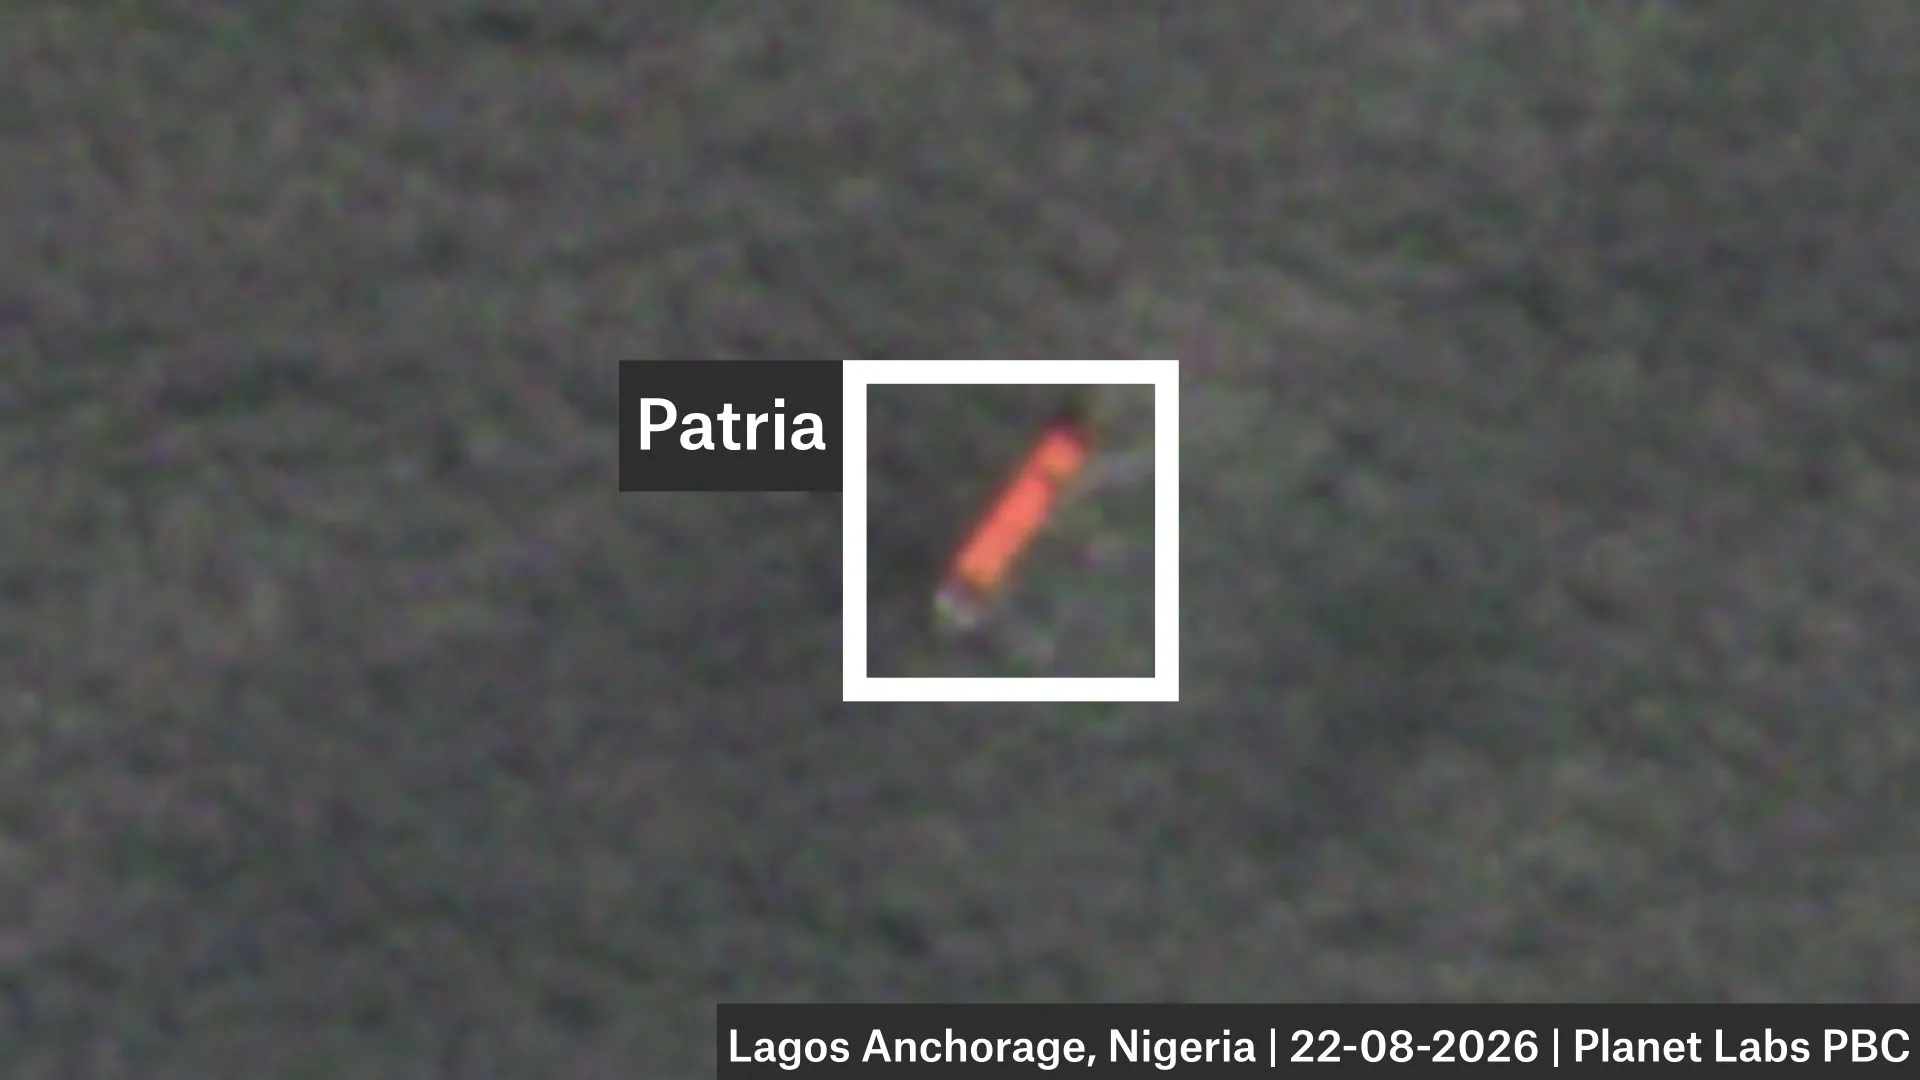
Credit: Planet Labs PBC.
Examining the Patria’s Draught
We reviewed the draught of the ship at each port visit and found that the ship’s draught always dropped after a stay at the Port of Douala, suggesting it was unloading there.
A ship’s “draught” is the distance from the bottom of the hull (the keel) to the waterline. When loaded, a ship is heavier and sits lower in the water (e.g. a draught of six metres) than when it is unloaded (e.g. a draught of four metres).

In the period from March to July, the Patria made five port calls to Douala and each time the draught decreased. Conversely, it called four times at the Port of Owendo in Libreville, each time the draught increased, meaning the ship became heavier, suggesting it was loading.
The draught is self-reported by ships but usually when it arrives at ports this kind of data is checked – reporting accurate draught is also a safety issue for ships arriving and departing at ports.
Bellingcat asked the ship’s owners, managers and both ports if items were being transferred from Libreville to Douala but did not receive a response at time of publication.
Brown, the former US Naval Officer and now a Senior Advisor at United Against Nuclear Iran, said Patria’s movements were unusual.
“A sanctioned vessel linked to a prior military logistics shipment spending nearly six months operating between a small cluster of West African ports, Douala, and Owendo, without returning to a clear commercial trading pattern warrants scrutiny,” Brown told us.
“While innocent explanations such as mechanical issues, commercial disputes, lack of cargo, chartering delays, or prolonged maintenance are possible, the combination of repeated regional port calls, extended periods at anchor, and an apparent absence of a normal point-to-point trading cycle is atypical for a merchant vessel.”
He added that the current period of more than 30 days at the Lagos Anchorage, in particular, is noteworthy.
David Soud, Head of Research and Analysis at I.R Consilium also told Bellingcat that Patria’s prolonged Lagos Anchorage could have innocent explanations such as its need for ongoing repairs, or that its operators were out of money, but added that there could also be more calculated reasons and it was laying low for a while.
Bellingcat analysed AIS data from Lagos Anchorage and found that while there has been high congestion, no other RoRo or container vessel waited longer than 10 days to enter the port in the period that Patria has been at Lagos Anchorage. At time of writing, Patria has been in anchorage for more than 30 days.
Regarding the Patria’s apparent deliveries of cargo between Libreville in Gabon, and Douala in Cameroon, Soud told Bellingcat:
“Given the vessel’s history of transporting military equipment to African seaports for overland delivery to Russian and allied forces in the Sahel, it’s not out of the question that some form of supplies for Russian or other forces could be picked up in Gabon, whose government has developed a closer relationship with Moscow, to be discharged in Douala, which is the main entry point for goods going to Central African Republic.”
Bellingcat asked the Nigerian Ports Authority why Patria had been in anchorage for so long, whether it had applied to dock and whether the port was aware of its sanctioned status but did not receive a response at time of publication.
The ports of Douala in Cameroon and Owendo in Libreville, Gabon did not respond to Bellingcat’s requests for comment about the Patria’s visits and the cargo it was carrying.
Bellingcat also contacted the two companies connected to the vessel – Hanro Shipping and Sakhalin Shipping Company which are listed as the vessel’s owner and manager respectively in sanctions documents. We also contacted the company connected to JS Gratitude. We did not receive a response at time of publication.
Youri van der Weide, Galen Reich, Yörük Işık contributed to this report.
Cover image: Planet Lab image shows the Patria at the Port of Douala, Cameroon, on April 17, 2026. Credit: Planet Labs PBC.
Bellingcat is a non-profit and the ability to carry out our work is dependent on the kind support of individual donors. If you would like to support our work, you can do so here. Subscribe to our Newsletter and follow us on Bluesky here, Instagram here, Reddit here and YouTube here.
The post Tracking a Sanctioned Russian Vessel’s West African Odyssey appeared first on bellingcat.
20.08.2026 à 22:50
Satellite Imagery Documents New Border Patrol Road Construction in Big Bend National Park
Logan Williams
Sign up here to receive Bellingcat’s biggest investigations by email as soon as they are published. Satellite images obtained and analysed by Bellingcat show over five miles of new road constructed in Big Bend National Park in southwestern Texas, part of a US Customs and Border Protection (CBP) “Smart Wall” installation, which includes roads, barriers, […]
The post Satellite Imagery Documents New Border Patrol Road Construction in Big Bend National Park appeared first on bellingcat.
Texte intégral (1336 mots)
Sign up here to receive Bellingcat’s biggest investigations by email as soon as they are published.
Satellite images obtained and analysed by Bellingcat show over five miles of new road constructed in Big Bend National Park in southwestern Texas, part of a US Customs and Border Protection (CBP) “Smart Wall” installation, which includes roads, barriers, lighting and cameras.
The project was paused earlier this week after pushback from local residents, politicians and environmental groups.
The roads have been built adjacent to the Rio Grande, through the river’s floodplain and riparian forest, and include construction adjacent to Cottonwood Campground, Santa Elena Canyon, and Mariscal Canyon in the National Park.

The map above traces the new road construction in yellow. An unannotated version of the satellite image showing the new road can be found here while a before image of the same area where no road is visible can be seen here.

The new road extends to Cottonwood Campground, one of four campgrounds in Big Bend National Park.
The road can be seen crossing the riparian forest and smaller drainages before joining the campground access road. Imagery also appears to show bright yellow construction equipment staging in the campground area, where bulldozers were previously seen.


In the southernmost part of Big Bend National Park, additional new road construction is also visible near Mariscal Canyon and connecting to Talley Road.
CBP planning documents indicate that this section of the border will receive a four-to-six foot tall vehicle barrier in addition to the “smart wall” lighting and camera systems. Talley Road currently provides access to riverside backcountry campsites and hiking and boating access to Mariscal Canyon on the Rio Grande.

The map above traces the new road construction in yellow. An unannotated version of the satellite image showing the new road can be found here. A before image of the same area where no road is visible can be seen here.

Support Bellingcat
Your donations directly contribute to our ability to publish groundbreaking investigations and uncover wrongdoing around the world.
CBP Commissioner Rodney Scott described the construction activities as “survey and design work” in an August 13 statement. He also stated that CBP is “building one new access road, improving existing roads, installing detection technology, and placing vehicle barriers in limited, strategic locations.”
However, by August 17 Scott had announced a “pause” of construction activities in the face of bipartisan criticism of the project’s impact to the environment, recreation access, and the local economy
The Big Bend Border Patrol Sector sees the fewest migrant apprehensions of any part of the US southern border, according to CBP’s own data.
Bellingcat is a non-profit and the ability to carry out our work is dependent on the kind support of individual donors. If you would like to support our work, you can do so here. Subscribe to our Newsletter and follow us on Bluesky here, Instagram here, Reddit here and YouTube here.
The post Satellite Imagery Documents New Border Patrol Road Construction in Big Bend National Park appeared first on bellingcat.
- GÉNÉRALISTES
- Le Canard Enchaîné
- La Croix
- Le Figaro
- France 24
- France-Culture
- FTVI
- HuffPost
- L'Humanité
- LCP / Senat
- Le Media
- La Tribune
- Time France
- EUROPE ‧ RUSSIE
- Courrier Europe Ctrale
- Desk-Russie
- Euractiv
- Euronews
- Toute l'Europe
- Afrique ‧ Asie ‧ Proche-Orient
- Haaretz
- Info Asie
- Inkyfada
- Jeune Afrique
- Kurdistan au féminin
- L'Orient - Le Jour
- Orient XXI
- Rojava I.C
- INTERNATIONAL
- Courrier International
- Equaltimes
- Global Voices
- Infomigrants
- I.R.I.S
- The New-York Times
- OSINT ‧ INVESTIGATION
- OFF Investigation
- OpenFacto°
- Bellingcat
- Disclose
- G.I.J
- I.C.I.J
- OPINION
- Au Poste
- Cause Commune
- CrimethInc.
- Hors-Serie
- L'Insoumission
- Là-bas si j'y suis
- Les Jours
- LVSL
- Politis
- Quartier Général
- Rapports de force
- Reflets
- Reseau Bastille
- StreetPress
- OBSERVATOIRES
- Armements
- Acrimed
- Conspisme
- Culture
- Curation IA
- Extrême-droite
- Human Rights Watch
- Inégalités
- Justice fiscale
- Liberté de création
- Multinationales
- Situationnisme
- Sondages
- Street-Médics
- Routes de la Soie
- Wokisme